
Figure 1. Temperature latency curve.
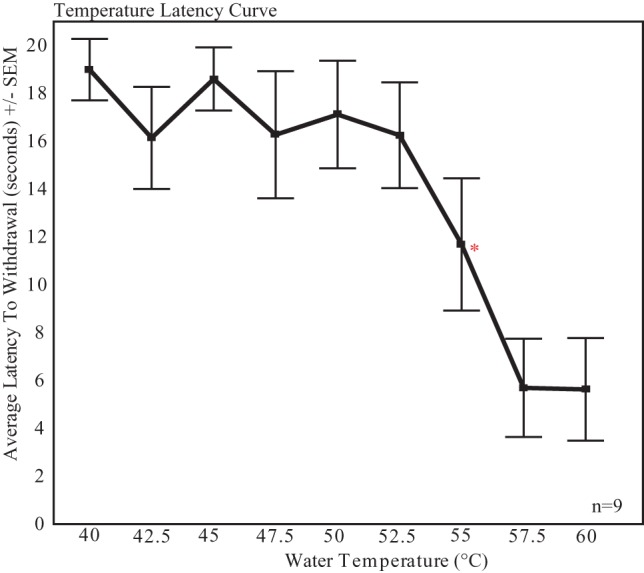
The curve showing mean (+/− standard error) latency to withdrawal the foot at increasing water temperatures in male starlings. The temperature of 55.5°C (indicated with an asterisk) was selected for all experiments as it fell within the slope of the curve and generated a measurable response in all subjects.