
Figure 2. The foot withdrawal response is opioid sensitive.
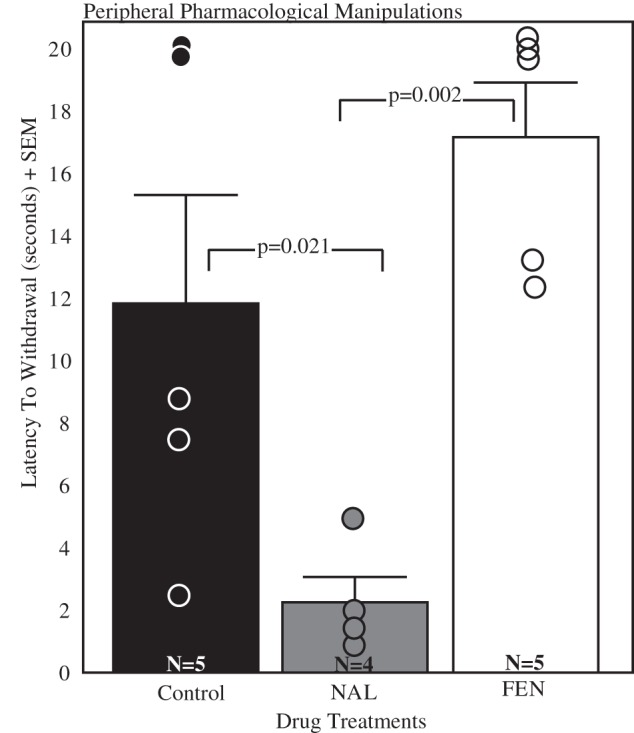
Mean latency to withdrawal and standard error in males receiving peripheral injections of diH20 (control; black bar); 20.0 mg/kg naloxone (NAL; gray bar); 0.25 mg/kg fentanyl (FEN; white bar). Individuals are represented by a single circle in each condition. Sample sizes are indicated in the bottom of each bar. Brackets indicate the results of the Fisher post hoc contrasts.