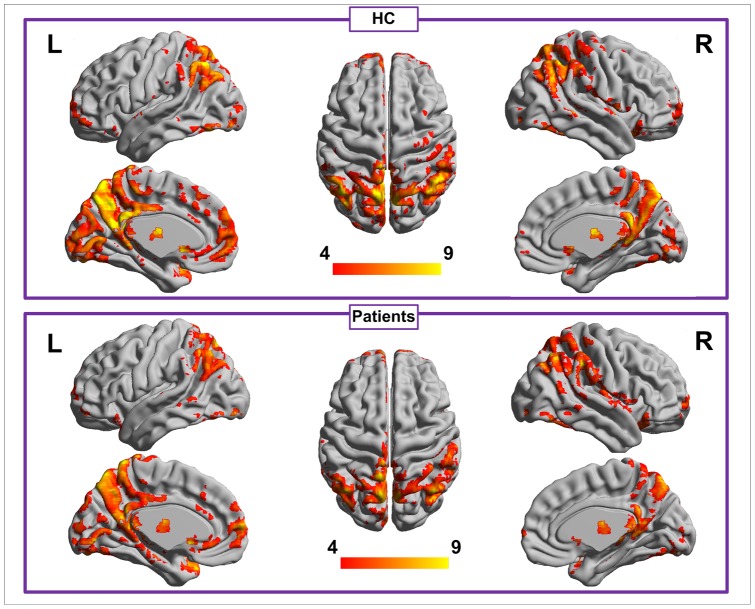
Figure 1. Within-group ALFF maps for the healthy control and cirrhotic patient groups at a corrected P<0.05.
Within each group, PCC/PCu, MPFC, IPL, and occipital areas show high ALFF values. ALFF = amplitude of low frequency fluctuation; PCC = posterior cingulate cortex; PCu = precuneus; MPFC = medial prefrontal cortex; IPL = inferior parietal lobe.

