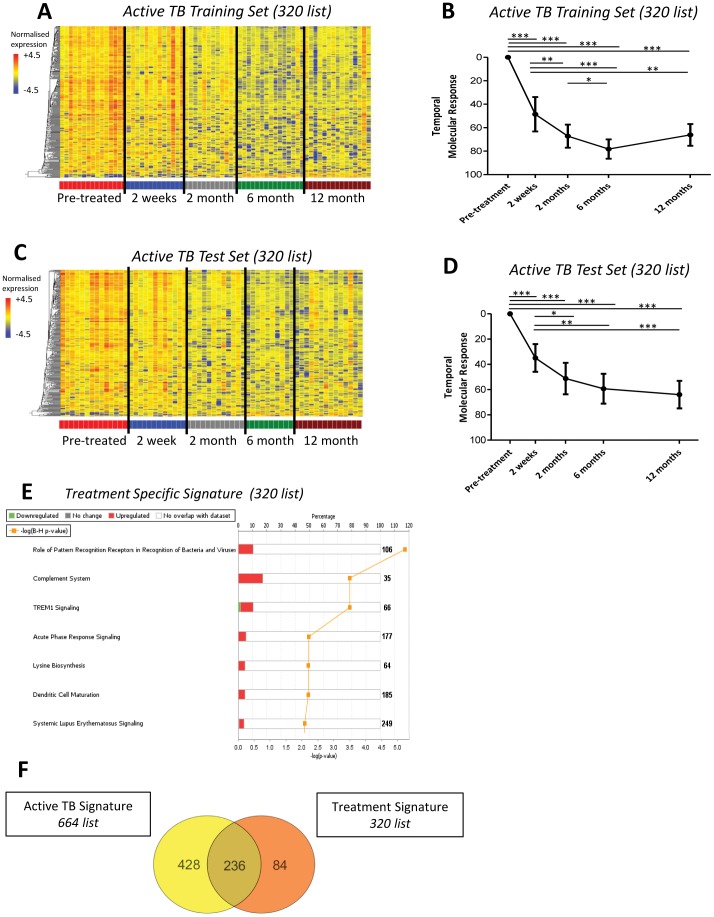
Figure 3. Specific treatment response signature significantly diminishes at 2 weeks onwards.
A specific TB treatment response signature was derived from significantly differentially expressed genes between untreated samples in the South Africa Active TB Training Set and their corresponding 6 month samples, 320 transcripts. (A) Heatmap of South Africa 2011 Active TB Training Set, normalised to the median of all transcripts, shows transcripts differentiating over time in response to treatment. (B) Temporal molecular response further shows significant and early changes in response to TB treatment in the Active TB Training Set (linear mixed models, bars represent mean & 95% confidence intervals, *** = p<0.001, ** = p<0.01, * = p<0.05). (C) Heatmap of South Africa 2011 Active TB Test Set, normalised to the median of all transcripts, shows transcripts differentiating over time in response to treatment. (D) Temporal molecular response also shows in the Active TB Test Set significant and early changes in response to TB treatment. (E) IPA of the 320 transcripts showing the most significant pathways. (F) Venn diagram shows many overlapping genes between the active TB 664-transcript signature and the treatment specific 320-signature.

