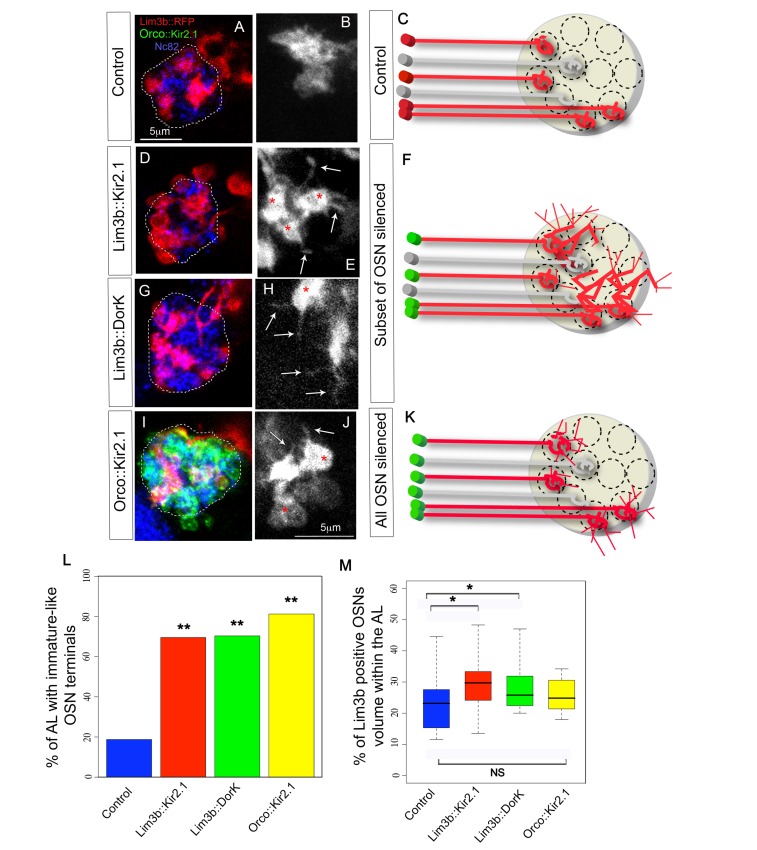
Figure 7. Effects of silencing a subset or all OSNs on OSN terminal arborizations.
(A–K) Confocal z projections and schematics of four OSN terminals (Lim3b-Gal4;UAS-mRFP, red in all except B, E, H, and J where it is white) in the AL (Nc82 staining, dashed line in A, D, G, and I, and yellow circle in C, F, and K) of 21 h AEL animals, in control (A–C), Lim3b::Kir2.1 (D–F), Lim3b::DorK (G–H), and Orco::Kir2.1 (I–K). (B, E, H, and J) show some of these four OSN terminals at a higher magnification and without Nc82 counter-staining to facilitate the visualization of OSN terminal morphologies under each of the experimental conditions. In (I) green staining is Orco-LexAOp;LexA-Kir2.1EGFP. In (C, F, and K) red OSNs represent the four Lim3b-Gal4 positive OSNs, and the grey OSNs represent the rest of the OSNs that we are not visualizing (only two out of the 17 non-visualized OSNs are represented in the schematic). The green cell bodies mean that Kir2.1 (or DorK) is being expressed in those cells. In control animals each OSN terminal is restricted to a single glomerulus and no filopodia are observed (A–C; in A the four Lim3b positive terminals are shown, and in B only two OSN terminals are shown). When a subset of four OSNs are hyperpolarized by expressing either Kir2.1 (D–F) or DorK (G–F), these OSNs expand and occupy neighbouring glomeruli (D and G) and have immature-like morphologies (red asterisks) with filopodial projections (white arrows). When all OSNs are hyperpolarized (I–K), OSNs remain more restricted to glomerular-sized territories (I), although they also have immature-like morphologies with filopodia (J). (L) Quantification of immature-like morphologies at 21 h AEL in control (blue), Lim3b::Kir2.1 (red), Lim3b::DorK (green), and Orco::Kir2.1 (yellow). Bar plot indicates the percentage of ALs with axons with immature-like morphologies. Two asterisks (**) indicate p≤0.01 when compared to controls. (M) Quantification of occupancy of the four Lim3b-Gal4 terminals within the AL volume (defined by the Nc82 antibody staining contour) at 21 h AEL in control (blue), Lim3b::Kir2.1 (red), Lim3b::DorK (green), and Orco::Kir2.1 (yellow). Box plots show the median of the distribution (middle line), the 75th percentile (upper limit of box), and 25th percentile (lower limit of box). Whiskers indicate the highest and lowest value of each experimental group. A single asterisk (*) indicates p≤0.05. N.S indicates p>0.05 (see Figure S3).

