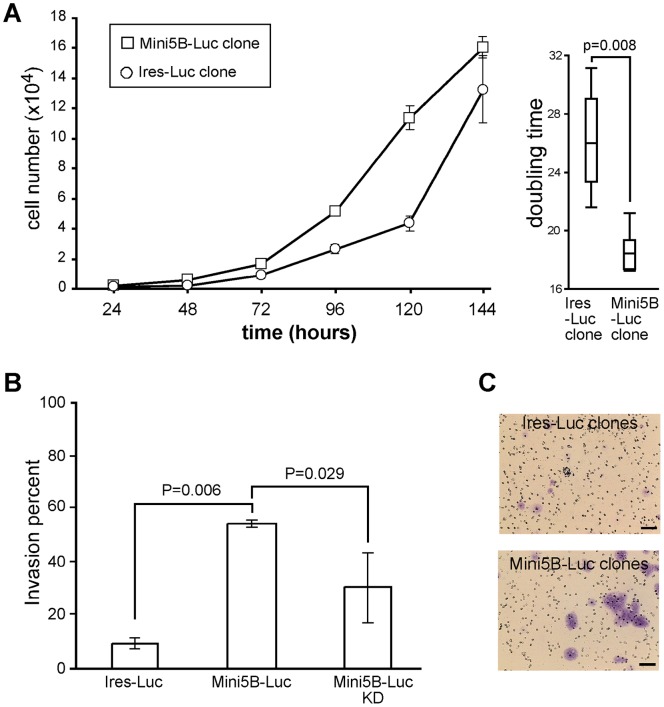
Figure 2. Promotion of proliferation and invasion of MCF7 cells in vitro by Mini5B.
(A) Growth curves of Mini5B–Luc and Ires–Luc clones. Data are expressed as the mean ± SEM. The curve is representative of three experiments. Doubling time was calculated for the two clones. (B) Invasion percentages of Ires–Luc and Mini5B–Luc clones and Mini5B–Luc KD population. Data are expressed as mean ± SEM. The diagram is representative of two experiments. (C) Illustration of invading cells stained with toluidine blue. Scale bar 50 µm.

