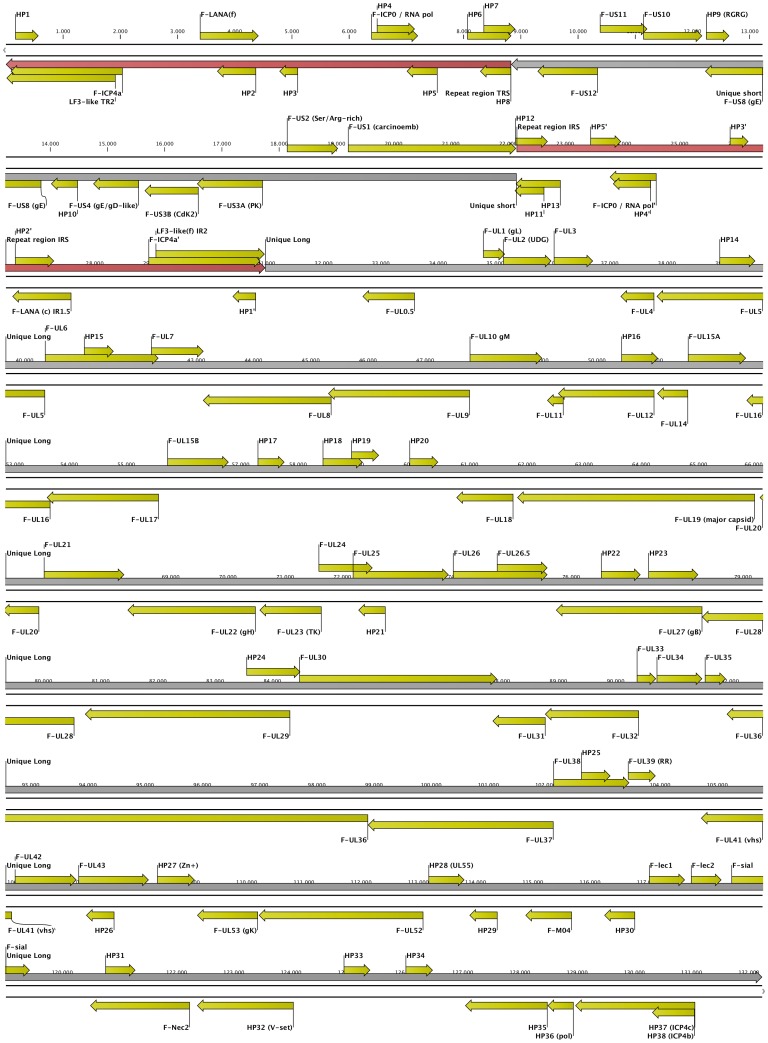
Figure 1. Genomic Map of ChHV5 as determined from BAC CH-651-60O9.
The linearized, double stranded map, drawn to scale, shows the Repeat Sequences (TRS and IRS) in brown, the Unique Sequences (US and UL) in grey, and the predicted open reading frames (ORFs) in yellow. The relative orientation of each ORF is symbolized in the direction of its arrow shape. The ORF designations and the scale refer to the information provided in Tables 2 through 4.

