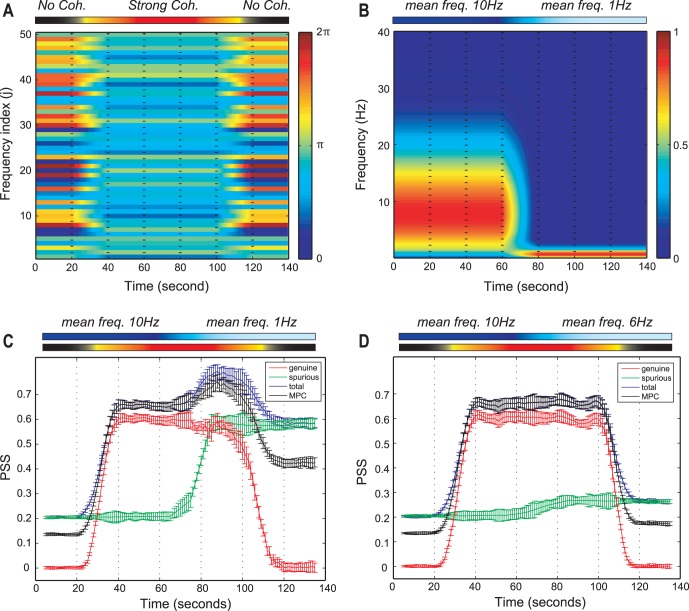
Figure 1. The test of the three PSS indices using the simulated EEG time series.
(a) The phases of 50 sine waves for a simulated EEG time series are presented. The non-coherent (0–20 s and 120–140 s) and coherent (40–100 s) phases are given to the simulation, with two linear state transitions (20–40 s and 100–120 s). The color bar on the right side indicates a radian within 0 to  and the frequency index (j) reflects the indices of first 50 sine waves among 5,000 (
 of Eq.4) for visualization. (b) The time-frequency plot of a simulated EEG time series is presented. The two time periods have two different dominant frequencies (10 Hz for the first half period and 1 Hz for the other half). The state transition between two dominant frequencies takes place during 60–80 s. The color bar on the right side denotes the probability density for the frequencies. (c) The total, spurious, genuine PSS and the mean phase coherence (MPC) for the two mean frequencies (10 Hz and 1 Hz) are presented. The genuine PSS (red) correlates well with the modulated coherence, while the spurious PSS (green) correlates with the mean frequency. The MPC has non-zero values in non-coherent periods, which appears amplified in the lower mean frequency period (1 Hz). (d) Same as (c), but with means frequencies of 10 and 6 Hz, respectively. The spurious PSS was significantly reduced with the mean frequency of 6 Hz, but was still larger than that of 10 Hz. The error bars denote the standard deviation. The upper bars in (a)–(d) indicate the states of coherence and different mean frequencies across EEG epochs.

