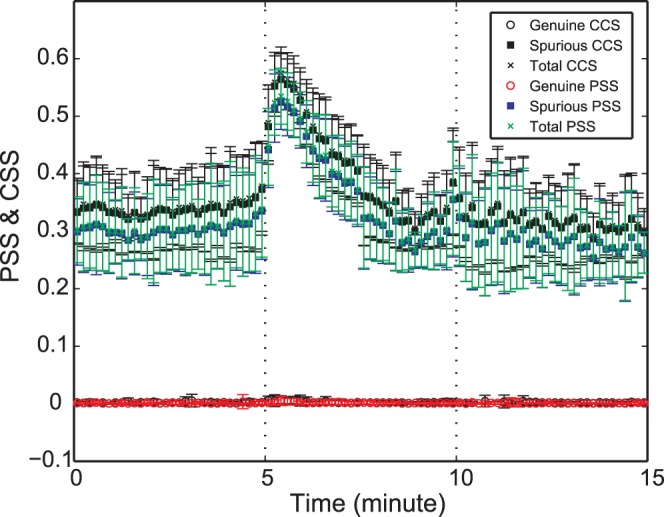
Figure 3. Spurious phase synchronization strength (PSS) during general anesthesia.

The mean of genuine, spurious and total PSS over all randomized data sets generated from all subjects’ original EEG data are presented over time (the error bar denotes the standard deviation). The spurious PSS (blue square) and the spurious correlation strength by Pearson correlation coefficient (black square, denoted as “CCS”) were compared. (Vertical dotted lines: loss of consciousness and return of consciousness points, sequentially). The linear Pearson correlation and the phase synchronization produce a large spurious component after anesthesia.
