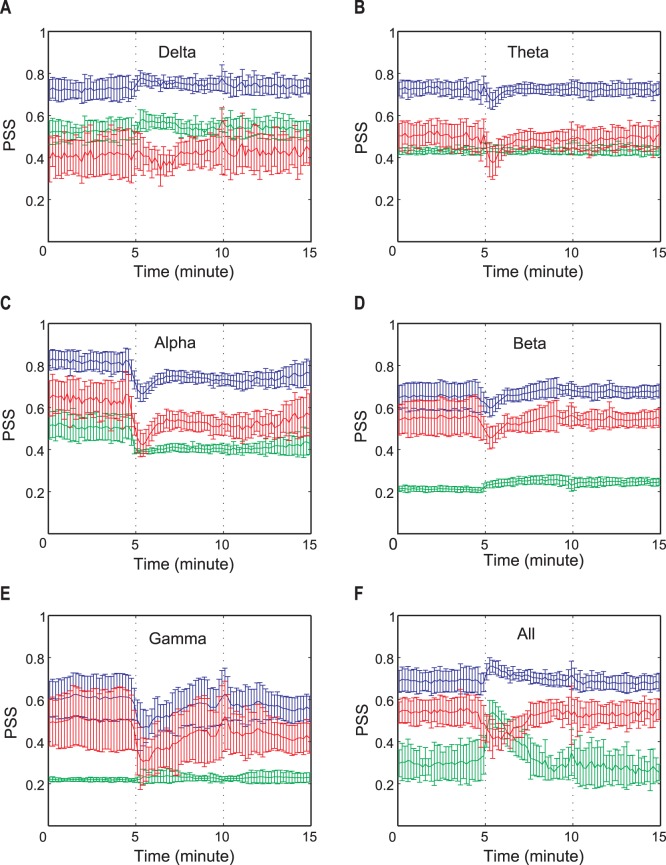
Figure 5. The temporal evolution of genuine, spurious and total PSS during general anesthesia for the six frequency bands.
The mean genuine, spurious and total PSS are denoted by different colors (red: genuine PSS; green: spurious PSS; and blue: total PSS). The error bar denotes the standard deviations of genuine, spurious and total PSS values over all EEG datasets. The vertical dotted lines indicate the loss of consciousness and recovery of consciousness, sequentially. Six frequency bands were studied: delta band (0.5–4 Hz), theta band (4–8 Hz), alpha band (8–13 Hz), beta band (13–25 Hz), gamma band (25–55 Hz) and whole band (0.5–55 Hz).

