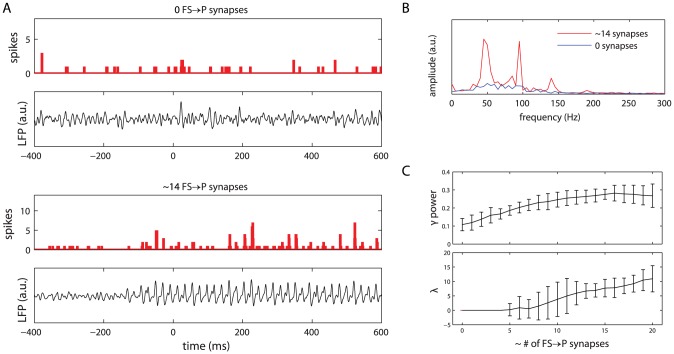
Figure 3. Pyramidal cells show gamma-synchronized activity when cells receive shunting inhibition.
(A) Spike histograms and simulated LFP traces for the unconnected ( FS to P synapses per P -cell) and connected (
 FS to P synapses per P -cell) conditions. Other input to the P -cells consisted of constant-rate Poisson spike trains. (B) Amplitude spectra for the simulated LFP in the connected (red) and unconnected (blue) conditions. The LFP spectrum for the connected condition shows a clear increase in power in the gamma band (30–80 Hz). (C) Relative gamma band power (top) and pyramidal cell network synchronization (bottom) as a function of the average number of GABA -ergic projections from the FS cells to a single P -cell. Relative gamma power increases steadily with the number of synapses, reaching a maximum at
  synapses per P -cell. Network synchronization starts to occur at
  synapses per P -cell. Shown are the mean values for
  simulation runs; error bars represent
  confidence interval.

