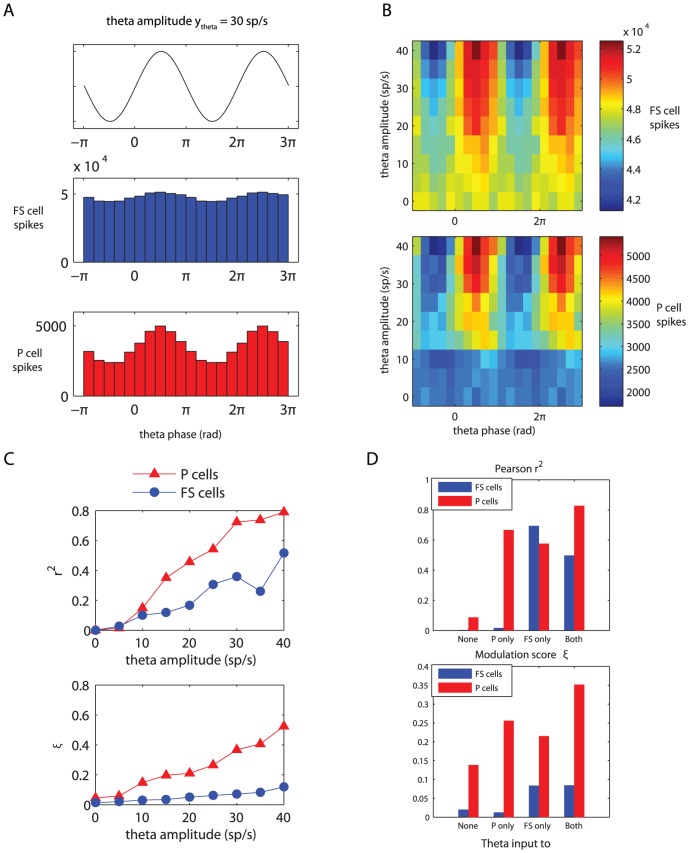
Figure 4. Theta modulation of fast-spiking and pyramidal cell spike times.
Fast-spiking cells received, on average, twice as many theta-modulated input synapses as the pyramidal cells, which, relative to the total input, is four times as many (see main text for details). (A) Spike histograms for the fast-spiking (blue, middle) and pyramidal (red, bottom) cells relative to theta phase. The amplitude of the incoming theta rhythm was set to  (see equation 8). Histogram bin size is
  . Above the spike histograms, the ‘raw theta signal’ (see equation 14) is plotted, to show which phases in the theta cycle correspond to peaks and troughs. (B) Spike counts (color code) relative to theta phase (x-axis) for the fast-spiking (top) and pyramidal (bottom) cells as a function of theta amplitude
  (y-axis). Spike count bin size is
  and bins were non-overlapping. (C) Two different measures of theta modulation of spike times: Pearson's
  (top) and relative modulation amplitude
  (bottom; see equation 15) as a function of incoming theta amplitude
  . (D) The same two measures as a function of theta input distribution.

