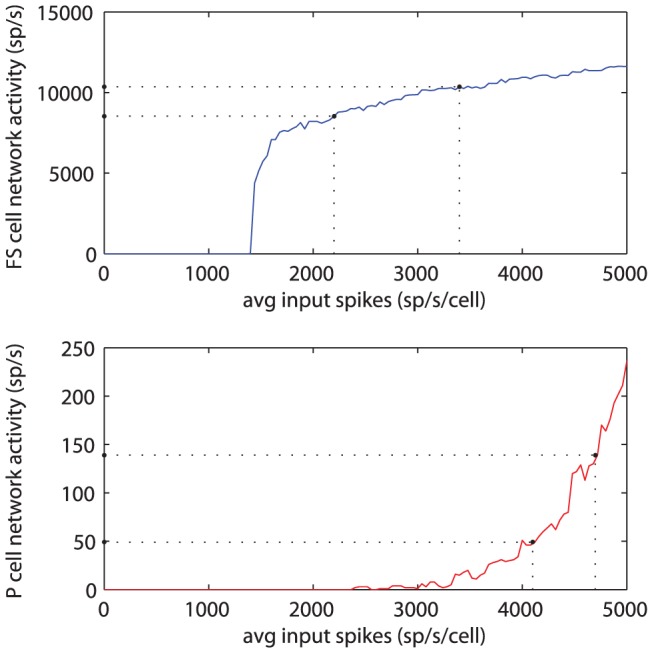
Figure 5. Frequency/input curves for the two model subnetworks: the fast-spiking cells (top) and the pyramidal cells (bottom).

The dotted lines perpendicular to the x-axis represent the total range of spike train input experienced by the subnetworks due to the theta-modulated input fibres. Dotted lines perpendicular to the y-axis represent the resulting subnetwork spike activity. While the theta-modulation of input spikes is stronger for the FS cells than for the P cells, the resulting difference in subnetwork spike activity is greater for the P cells, as can be observed from the intersection of the horizontal lines with the y-axis.
