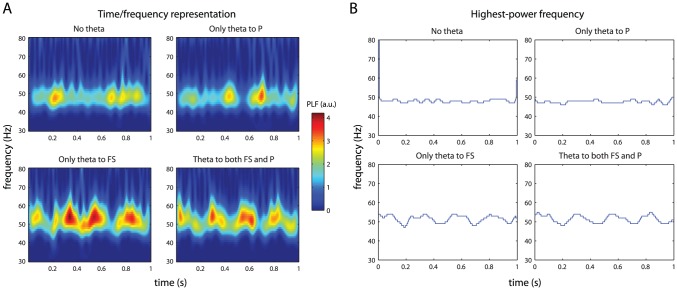
Figure 6. Effect of theta-modulated input on LFP gamma frequency.
(A) Time-frequency representations of one second of simulated LFP activity. The four panels correspond to theta-modulated input fibres projecting to different parts of the model network. (B) The frequency within the gamma band with the highest power, for the same data segments shown in A. Theta phase/gamma frequency coupling is observed if and only if the FS cells receive theta-modulated input.

