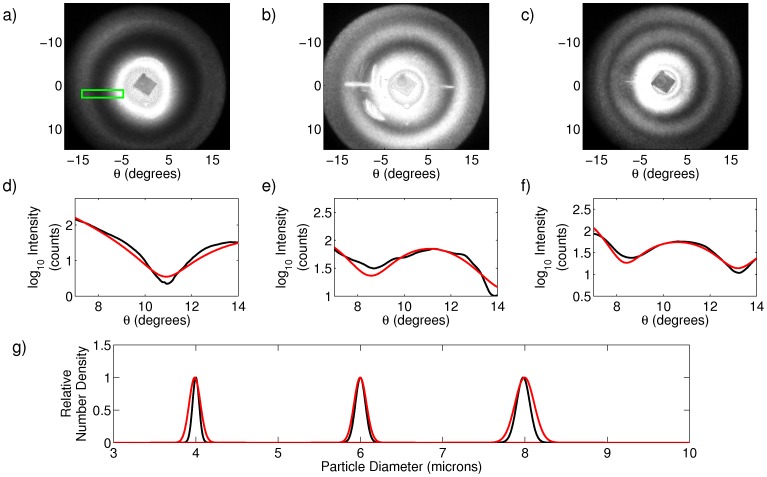
Figure 1. Scattering analysis of polystyrene sphere suspensions.
(a)–(c) Raw scattering data from 4, 6, and 8 micron particle suspensions, respectively. The green box in (a) shows the size and shape of the area within each image from which curves in (d)–(f) were calculated. (d)–(f) One dimensional cut throughs of scattering data from 4, 6, and 8 micron particle suspensions, respectively. Black curves are experimental data, and red curves are best fits to theory. (g) Expected (black) and predicted (red) particle size distributions (D in the text) as determined from scattering data.

