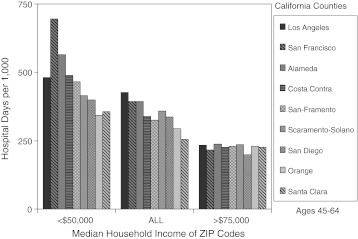
Figure 7.
Hospital utilization and median household income in California counties. The set of bar graphs on the left illustrates the number of hospital days per 1,000 in low-income ZIP codes (MHIs <$50,000) within eight counties and San-Framento. The middle set illustrates utilization in all ZIP codes in these counties, and the set on the right illustrates utilization in high-income ZIP codes (MHIs >$75,000.)

