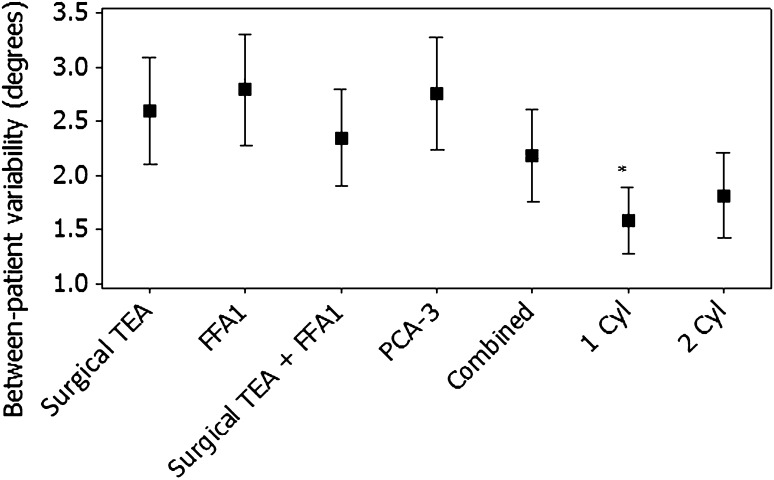
Fig. 3.
The graph shows between-patient variability of knee flexion axes. The error bars represent the 95% confidence intervals about the mean. FFA = functional flexion axis; TEA = transepicondylar axis; FFA1 = preincision FFA; PCA-3 = posterior condylar axis externally rotated by 3°; Cyl = cylinder.

