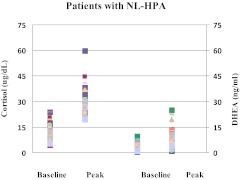
Fig. 2.
Baseline and LDC-stimulated cortisol (left two panels) and DHEA (right two panels) serum concentrations in patients with normal HPA function. Each character on the graph represents a data point on a subject. Both baseline and LDC-stimulated cortisol and DHEA levels were similar to the respective values in healthy subjects.

