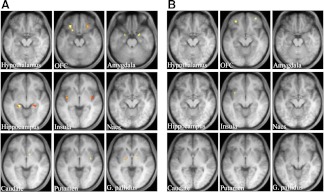
Fig. 3.
Neural response to food-specific stimuli in leptin-on patients. Food-specific activations in ROI in the brain under fasting (A) and postprandial (B) conditions. Activation is overlaid onto the group average T1-weighted anatomical axial images (right is right side of the brain). The brighter yellow color represents the higher Z-score. ROI areas are the same as described in Fig. 1.

