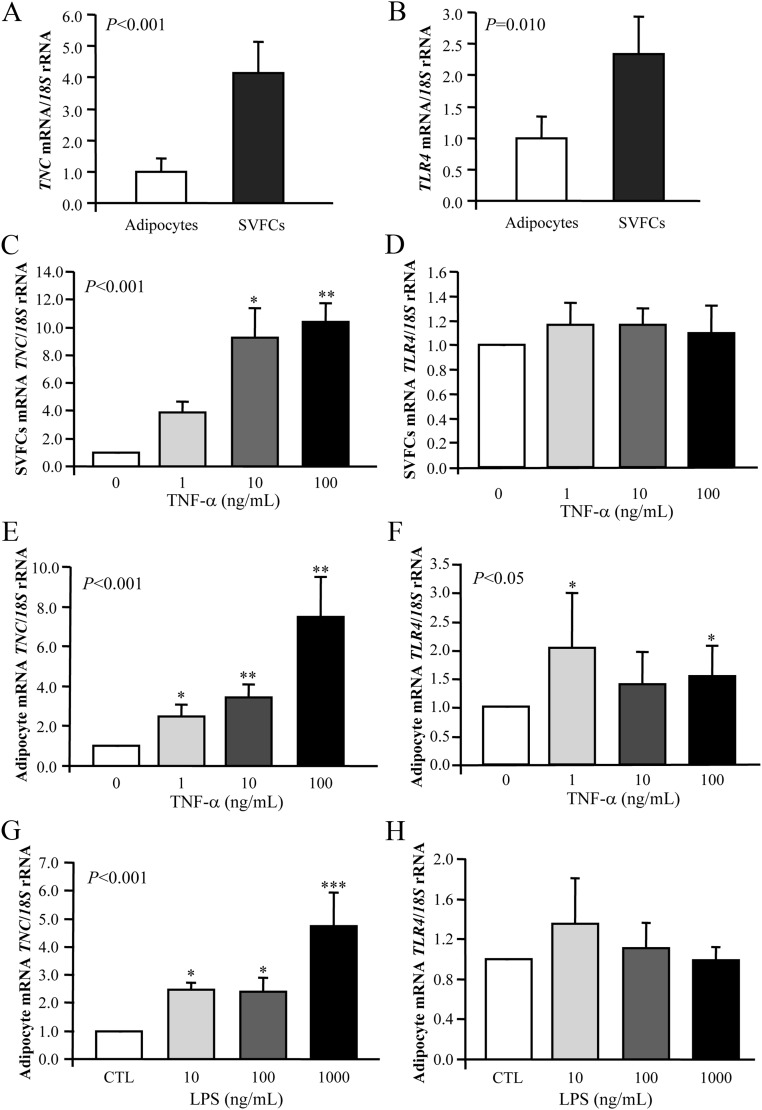
Fig. 3.
Gene expression levels of TNC and TLR4 in human visceral adipocytes and SVFC. A and B, Comparison of TNC and TLR4 gene expression in adipocytes and SVFC isolated from VAT of obese patients. Bars represent the mean ± sd of the ratio between the gene expression to 18S rRNA. The expression level in adipocytes was assumed to be 1 (adipocytes: n = 9; SVFC: n = 11). Statistical differences were assessed by a two-tailed unpaired Student's t test. *, P < 0.05, **, P < 0.01 vs. adipocytes. C and D, Effect of TNF-α. Bar graphs show the effect of TNF-α incubated for 24 h on the transcript levels of TNC and TLR4 in visceral SVFC. E and F, Transcript levels of TNC and TLR4 after 24 h incubation with TNF-α in visceral adipocytes. G and H, Gene expression levels of TNC and TLR4 in human visceral adipocytes after LPS treatment. The gene expression levels in the unstimulated cells were assumed to be 1. Values are the mean ± sd (n = 6 per group). Differences between groups were analyzed by one-way ANOVA followed by Tukey's tests. CTL, Control. *, P < 0.05; ***, P < 0.01 vs. unstimulated cells.

