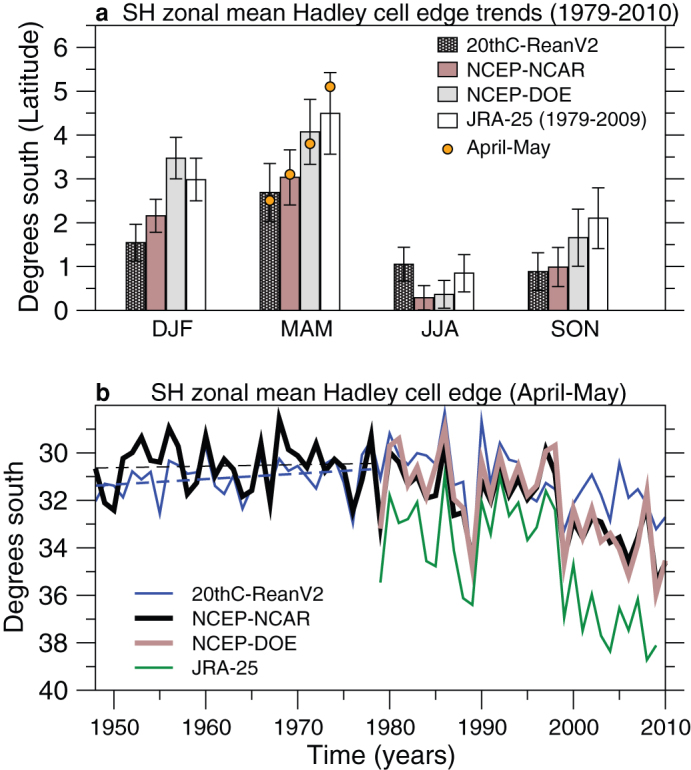
Figure 1. Poleward shifts in the southern branch of the zonal mean Hadley cell edge.

(a) Seasonal shifts of the southern branch of the zonal mean Hadley cell edge from four reanalyses products over 1979–2010: 20thC-ReanV2, NCEP-NCAR, NCEP-DOE and JRA-25 (data only available up to 2009 at time of writing), based on linear trends; (b) the corresponding time series for April-May with linear trend lines (dashed) for 20thC-ReanV2 and NCEP-NCAR from 1948–1978. Error bars in (a) signify the standard error of the trends.
