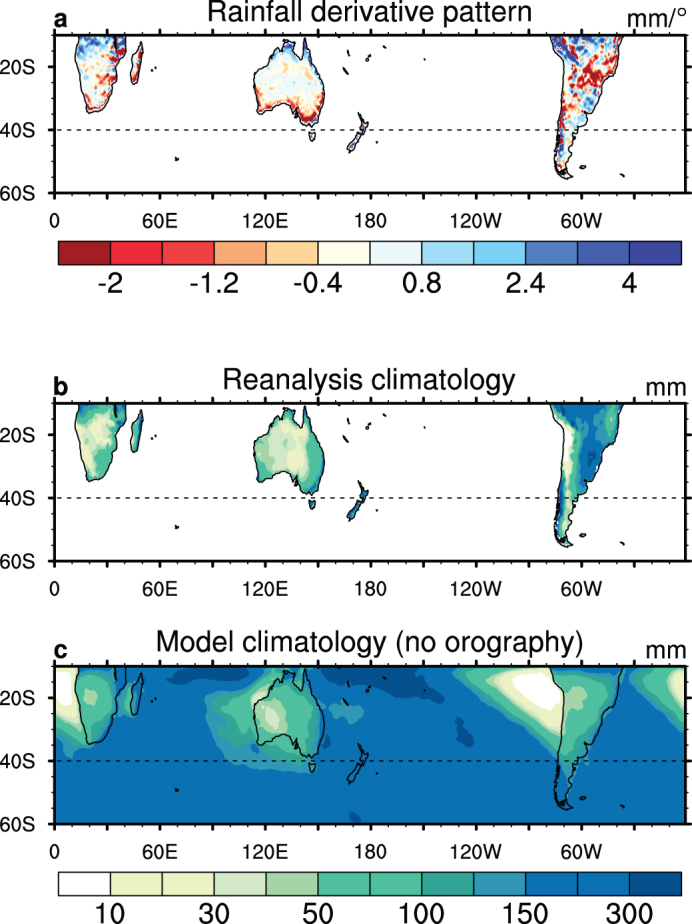
Figure 4. April-May rainfall change pattern from a poleward mean climate shift, and comparison between observed climatology and simulated climatology without orography.

(a) Pattern of the latitudinal gradients of climatological April-May rainfall for identifying regions where a rainfall reduction is potentially attributable to a poleward shift of the mean climate; (b) April-May rainfall climatology for observations (four-rainfall product average for 1951–2010); and (c) a model simulation with “no orography” (1980–2000). The units in (a) are mm/degree of shift; and (b) and (c) are mm. The datasets used to calculate the derivatives and climatology are the same as in Fig. 2. The 40°S midlatitude line is also shown.
