
FIG. 2. Comparison of the deduced amino acid sequences of bovine, dog, and rat A1AR.
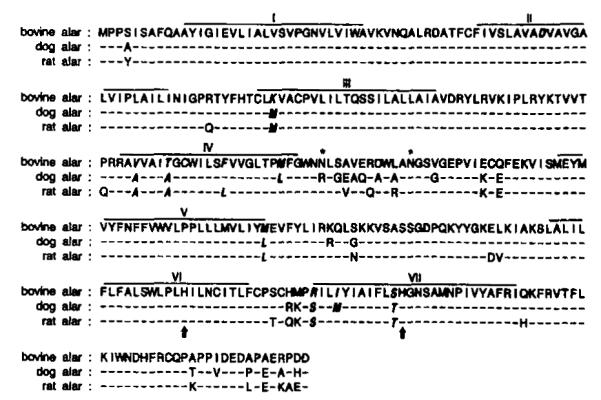
Dashes represent identical amino acids with differences noted in canine and rat sequences. Putative transmembrane domains (I–VII) are marked with a solid line. Italicized amino acids represent changes in the A1ARs in these transmembrane regions. Possible sites for glycosylation in extracellular loop 2 are marked by asterisk. His-251 and His-278 are marked by ↑.