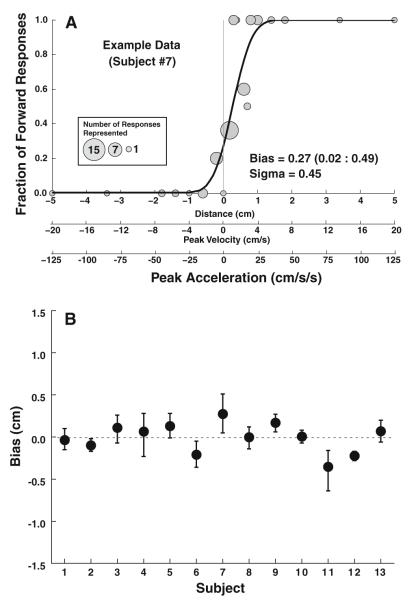
Fig. 2.
Single Interval data. a: Example data from a single subject (#7). Each gray circle represents a single-stimulus level with the diameter of the circle proportional to the number of responses at that level. Positive displacements represent forward motion. The mean of the cumulative distribution function represents the bias with the best fit to this data (solid line) and was 0.27 cm with a 95 % confidence interval of 0.02–0.49. The scale below allows the comparison of displacement, peak velocity, and peak acceleration of the test stimulus. b: Summary of single interval data for all subjects. Error bars represent 95 % confidence intervals (CI)

