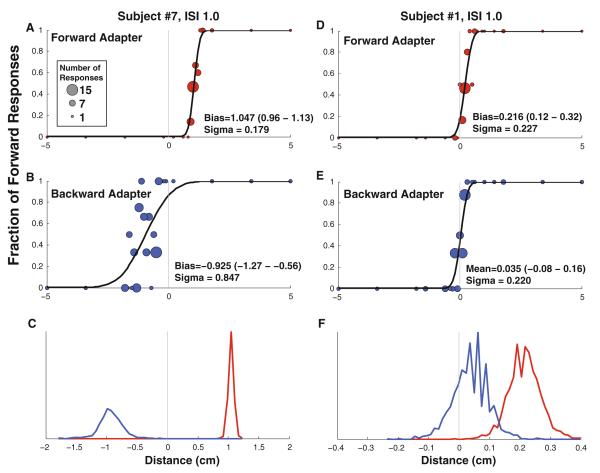
Fig. 3.
Vestibular perception following an adapting stimulus in two sample subjects. A circle is shown for each stimulus level presented with the number of stimuli represented proportional to the diameter of the data point. The test stimulus was delivered 1 s after the end of the adapter ended (ISI 1 s). Red symbols represent a forward adapter, and blue symbols represent a backward adapter. a, b: Exemplary data from subject #7 who had an usually large after effect. d, e Represent subject #10 who had a smaller aftereffect which remained significant. a, d: The adapter is forward motion. The mean is shifted to 1.05 cm for subject #7 and 0.22 for subject #10, indicating that after the adapter the subject would be more likely to perceive this forward motion as no movement. b, e: The adapter is backward motion. In both the cases, the mean is shifted in the negative direction relative to the forward adapter, indicating that small movements were much more likely to be perceived as forward movement. c, f: The cumulative distribution functions shown in the upper panels were refit to data that were randomly resampled ×2,000. These plots represent histograms of the biases determined from the resulting fits. In these plots, the scale of the X-axis has been changed relative to the other plots for clarity. In c, there was no overlap in the histograms indicating a highly significant difference (p < 0.0005). In f, the histograms overlapped and in 18 pairs of the 2,000 fits (p = 0.009), the bias with a backward adapter was found to be larger than with a forward adapter

