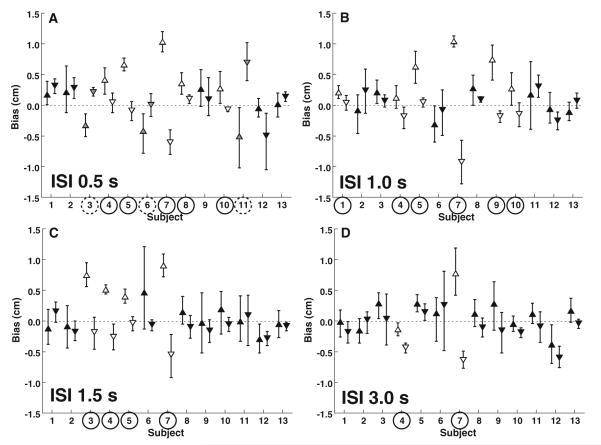
Fig. 4.
Summary of 2I response per subject for each inter-stimulus interval (ISI). Upward pointing triangles represent trials with forward adapters, and downward pointing triangles represent backward adapter trials. Error bars represent ±95 % CI. Open triangles represent significant differences that are also marked with a circle around the subject number. Subject numbers circled with a solid line indicate a significant TAE such that the perception of the second stimuli was shifted in the opposite direction of the adapter. Circles with a dashed line and gray filled triangles indicate a significant perceptual shift such that perception of the second stimulus was shifted in the same direction as the adapter

