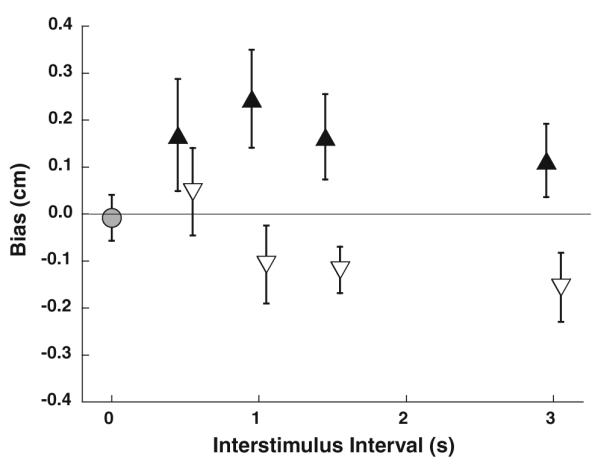
Fig. 6.

Summary of data from all 13 subjects. The single interval experiment is marked with a gray circle. Two-interval experiments are marked with triangles. Filled upward pointing triangles represent stimulus presentations with forward adapters, and open downward pointing triangles represent stimulus presentations with backward adapters. Error bars represent ±1 SEM
