
Fig. 3.
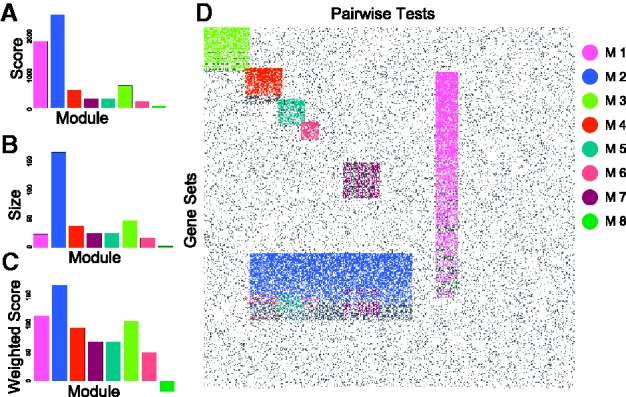
iBBiG bi-cluster analysis of the simulated dataset detects all modules (M1–M7) including those with overlaps (M3–M6). Plots show the (A) fitness score (S) (B) size (k) and (C) weighted score of the first eight modules. The weighted score is the log(k/m*S) where m is the total number of phenotypes. Modules M1–M7 are highlighted in (D) an image of the matrix in which rows and columns have the same order as Figure 1. The eighth module (M8) contains the residues of other modules which is reflected in a low weighted score