
Table 1.
Module nomenclature (M1–M7) is the same as that used in Figure 1
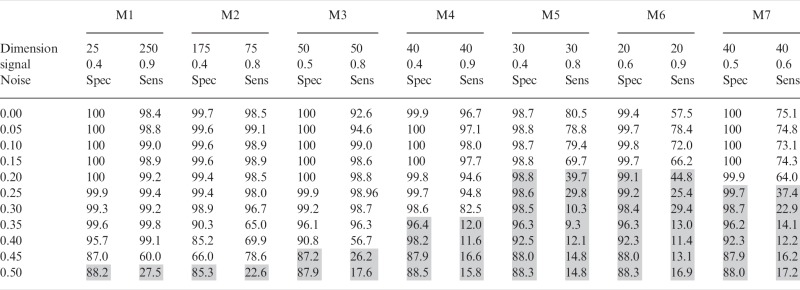 |
The first row indicates the dimension (number of columns and number of rows) of each module in the simulated dataset. The signal strength gradient within each module from the strongest to weakest signal-to-noise ratio is provided in the second row. For example M1 has 25 pairwise tests (columns) and 250 gene sets (rows) and a signal-to-noise is 0.9 in the first few rows which decreases to 0.4 as the number of gene sets reaches 250. The remainder of the table shows the impact of increasing background noise (between 0 and 50%) on the mean specificity and sensitivity of 100 analyses (alpha = 0.3, selection pressure = 1.2, population size = 100, mutation rate = 0.08, success ratio = 0.6). Results in which either sensitivity or specificity drop below 50% are highlighted with a grey background.