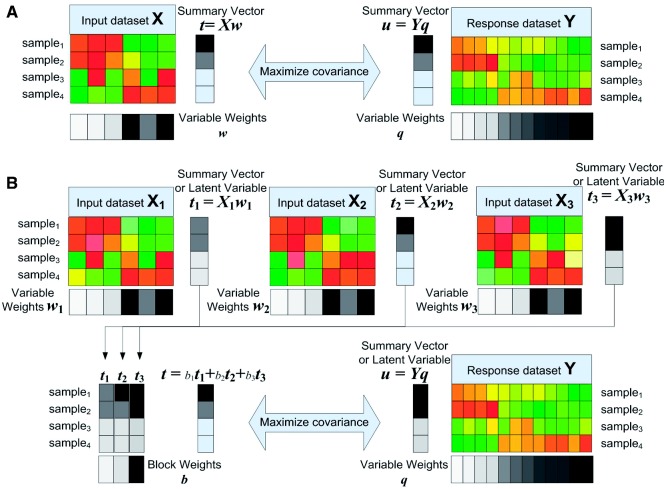
Fig. 2.
Illustration of (A) the covariance function for measuring the association of two matrices and (B) the problem formulation of multi-dimensional module discovery. To search a multi-dimensional module, columns of each block are represented by a ‘summary’ vector, e.g.  summarizing
  and u summarizing Y. Then the association between each input dimension
  and the response dimension Y is measured by the covariance of their each summary vectors, i.e.
  . The maximum covariance between summary vectors of
  and Y reveals a distinct association representing the coherent profiles of
  and Y. The maximization can be achieved by how we construct the summary vectors by weighting variables and samples. This discovery process is equivalent to the sparse version of the MBPLS problem

