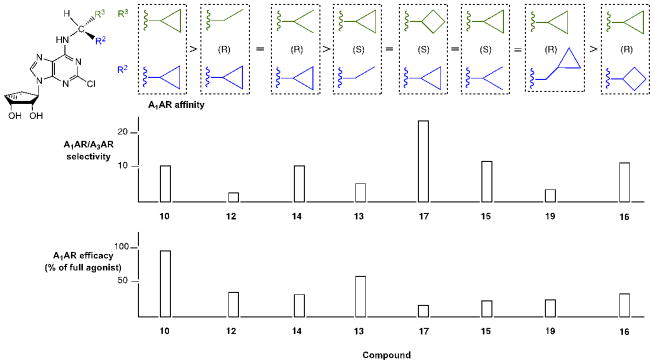
Figure 1.
Graphical comparison of the most potent truncated adenosine derivatives arranged by rank order of hA1AR binding affinity (ranging from 48 nM to 270 nM). The lower plots represent the hA1AR selectivity in comparison to the hA3AR and maximal efficacy at the hA1AR (data in Table 1).

