Figure 3.

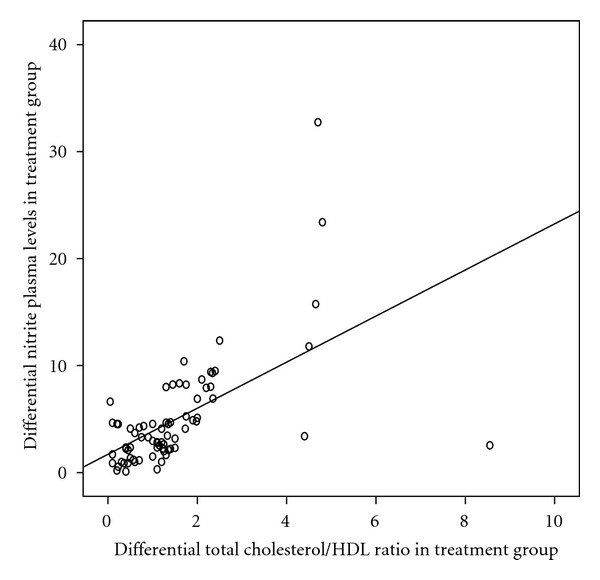
Positive Spearman's correlation between differential total cholesterol/HDL ratio and differential nitrite plasma levels in treatment group (r = 0.7, P < 0.001).

Positive Spearman's correlation between differential total cholesterol/HDL ratio and differential nitrite plasma levels in treatment group (r = 0.7, P < 0.001).