
Figure 4.
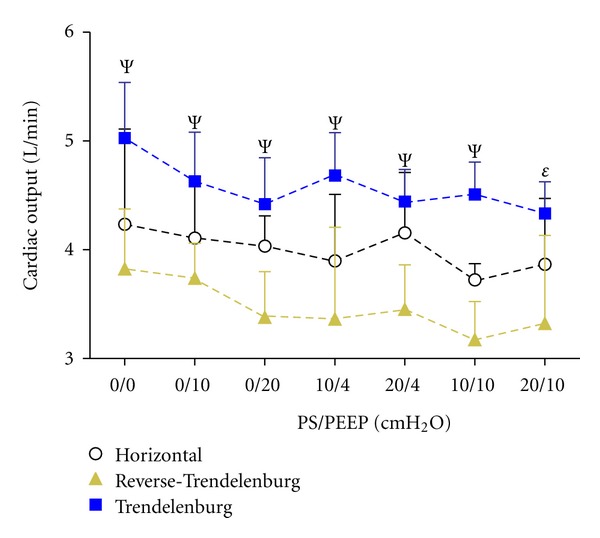
Effects of alternating positioning and varying positive pressure ventilation on cardiac output (CO). A clear association between positioning and CO was observed supporting the efficacy of our model of preload variation with positioning (P < 0.001). Ψ: P < 0.005 and ε: P < 0.05 for independence of positioning at individual ventilator settings. Data are presented as median and upper interquartile range.