Figure 2.

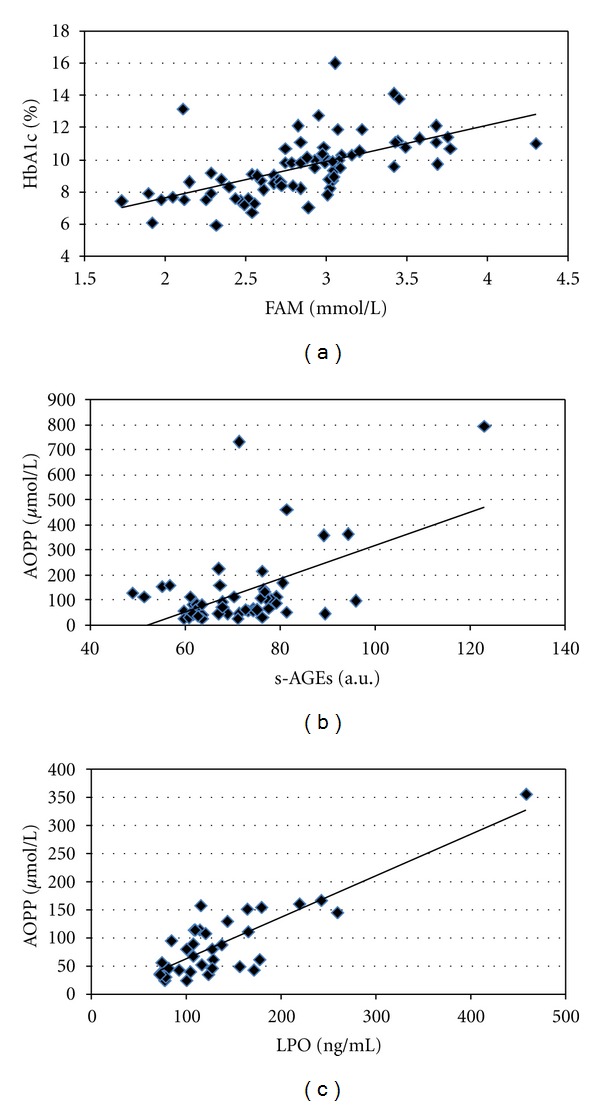
Significant correlations of (a) HbA1c and FAM (r = 0.601, P ≪ 0.001; n = 79), (b) AOPP and s-AGEs (r = 0.540, P ≪ 0.001; n = 54), and (c) AOPP and LPO (r = 0.833, P ≪ 0.001; n = 43) in all diabetic patients.

Significant correlations of (a) HbA1c and FAM (r = 0.601, P ≪ 0.001; n = 79), (b) AOPP and s-AGEs (r = 0.540, P ≪ 0.001; n = 54), and (c) AOPP and LPO (r = 0.833, P ≪ 0.001; n = 43) in all diabetic patients.