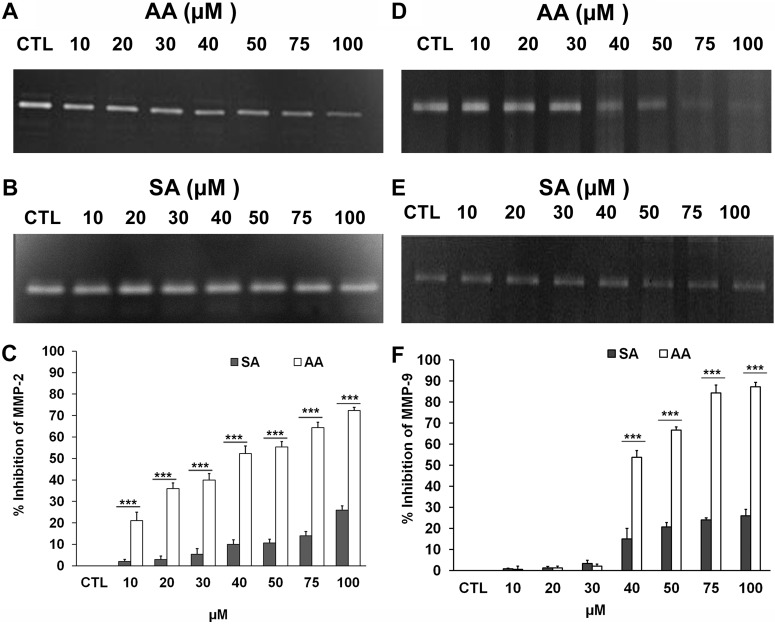
Fig. 6.
Effect of different modulators on MMP-2 and MMP-9 enzymatic activity. Zymogram showing MMP-2 activity of conditioned media from 3T3-L1 cells (not previously exposed to either anacardic acid or SA. A, treated with 0.5% DMSO (CTL) (lane 1) and 10, 20, 30, 40, 50, 75, and 100 μM anacardic acid (AA) isolated from CNSE (lanes 2–8, respectively). B, treated with 0.5% DMSO (lane 1) and 10, 20, 30, 40, 50, 75, and 100 μM salicylic acid (lanes 2–8, respectively). C, representative plot of the zymogram showing percentage MMP-2 inhibition at different concentrations of anacardic acid and salicylic acid. Zymogram showing MMP-9 activity of conditioned media from 3T3-L1 cells (not previously exposed to anacardic acid and salicylic acid). Each bar represents the mean ± S.E. of triplicate determinations from three independent experiments. ***, P < 0.001 (Student's t test). D, treated with 0.5% DMSO (lane 1) and 10, 20, 30, 40, 50, 75, and 100 μM anacardic acid isolated from CNSE (lanes 2–8, respectively). E, treated with 0.5% DMSO (lane 1) and 10, 20, 30, 40, 50, 75, and 100 μM salicylic acid (lanes 2–8, respectively). F, representative plot of the zymogram showing percentage MMP+ inhibition by anacardic acid and salicylic acid. Each bar represents the mean ± S.E. of triplicate determinations from three independent experiments. ***, P < 0.001 (Student's t test).

