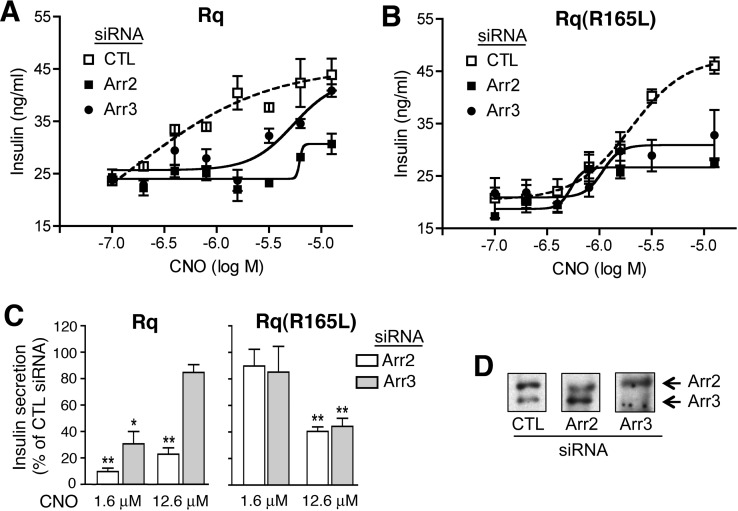
Fig. 4.
Insulin release studies. MIN6 cells were transfected with expression plasmids coding for either Rq (A) or Rq(R165L) (B), together with either arrestin-2 or -3 siRNA (arr2 or arr3 siRNA) or negative control siRNA (CTL). Representative concentration-response curves are shown. Three independent experiments gave similar results. C, pooled insulin release data obtained in three independent experiments. The panel shows relative insulin responses at two different CNO concentrations (CTL siRNA = 100%). *, p < 0.05; **, p < 0.01, versus the corresponding control response. D, arrestin levels were monitored via Western blotting using an anti-arrestin antibody that recognized both arr2 and arr3. Cells were incubated with increasing concentrations of CNO for 60 min at 37°C in the presence of 16.7 mM glucose, and insulin secretin into the medium was determined as described under Materials and Methods. CNO EC50 (in μM) and Emax values (in ng insulin/ml) were as follows (means ± S.E.M., n = 3): Rq + CTL siRNA, EC50 = 0.55 ± 0.33 and Emax = 43.5 ± 3.5; Rq + arr2 siRNA, EC50 = 4.60 ± 0.96 and Emax = 28.1 ± 1.5; Rq + arr3 siRNA, EC50 = 2.98 ± 0.84 and Emax = 39.9 ± 2.1; Rq(R165L) + CTL siRNA, EC50 = 2.14 ± 0.40 and Emax = 40.3 ± 3.82; Rq(R165L) + arr2 siRNA, EC50 = 1.16 ± 0.88 and Emax = 27.2 ± 0.80; and Rq(R165L) + arr3 siRNA, EC50 = 1.33 ± 0.32 and Emax = 26.9 ± 2.93.

