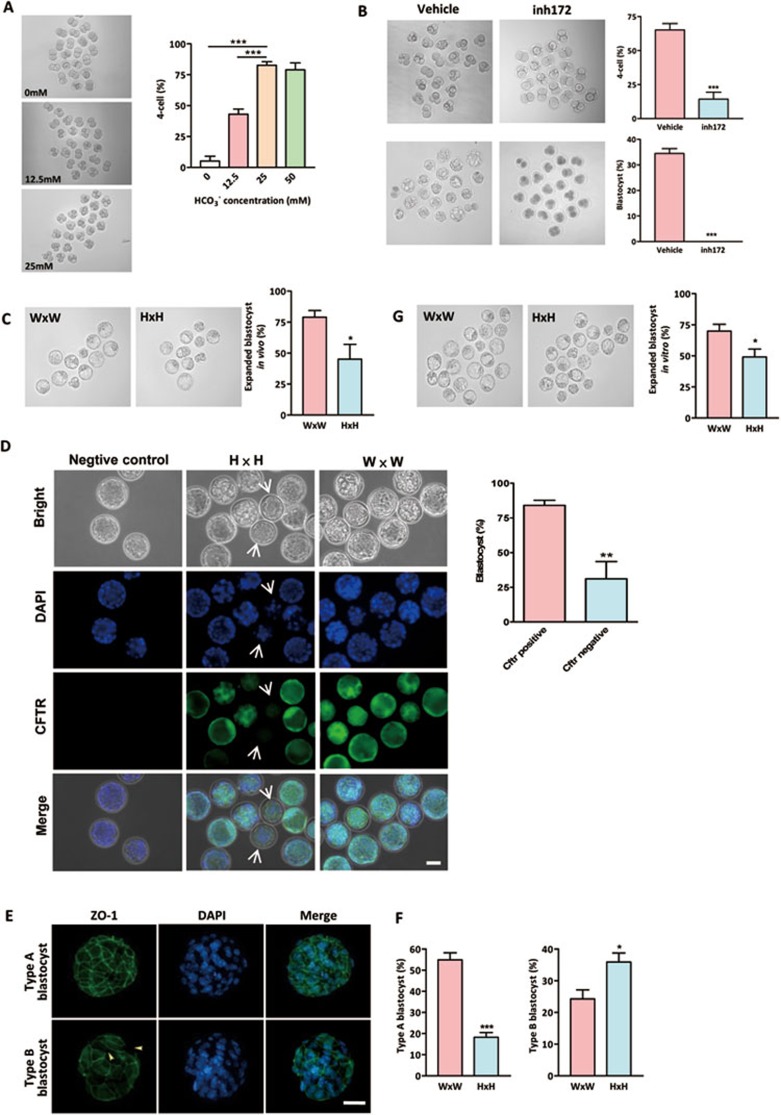
Figure 1.
Involvement of CFTR in HCO3−-dependent preimplantation embryo development. (A) Effects of HCO3− on preimplantation embryo development. Embryos were cultured in different concentrations of HCO3−. Transition from two-cell to four-cell embryos were significantly inhibited by removing (0 mM) or reducing extracellular (12.5 mM) HCO3− (0 mM group: 6/108 embryos; 12.5 mM group: 46/106 embryos; 25 mM group: 95/110 embryos; 50 mM group: 83/105 embryos). (B) CFTRinh172 (inh172) significantly reduced four-cell (n = 4, 12/85 embryos) and blastocyst formation (0/85 embryos) in embryo culture containing 25 mM HCO3− compared to the DMSO-treated vehicle control (four-cell: 57/88 embryos; blastocyst: 30/88). (C) Embryos obtained from Cftr+/− mice (H × H) on 3.5 dpc have reduced percentage of expanded blastocysts (31/68 embryos) as compared to those obtained from Cftr+/+ mice (W × W) (60/79 embryos). (D) Cftr−/− embryos, as indicated by lacking CFTR immunoreactivity (arrow), exhibit a remarkable decrease in blastocyst formation rate (5/13 embryos) as compared to CFTR-positive embryos (38/48 embryos). (E) Embryos were categorized into two types according to the developmental stages and ZO-1 fluorescence: type A blastocysts showed continuous and well-organized ZO-1 expression only at the cell junction, while type B blastocyst showed disrupted expression of ZO-1 at the cell junction (arrow head), and diffused localization in cytoplasm. (F) Embryos from Cftr+/+ and Cftr+/− mice were classified by ZO-1 expression patterns (green) in blastocyst stages. Nuclei were counterstained by DAPI. Embryos obtained from Cftr+/− mice have a significantly reduced percentage of type A blastocyst. (G) Embryos obtained from Cftr+/− mice (H × H) on 1.5 dpc have reduced expanded blastocyst formation (60/122 embryos) after in vitro culture for 72 h as compared to those obtained form Cftr+/+ mice (W × W) (87/126 embryos). Data are presented as mean ± SEM; one-way ANOVA (A); t-test (B-E); *P < 0.05 and ***P < 0.001. Scale bar, 50 μm.

