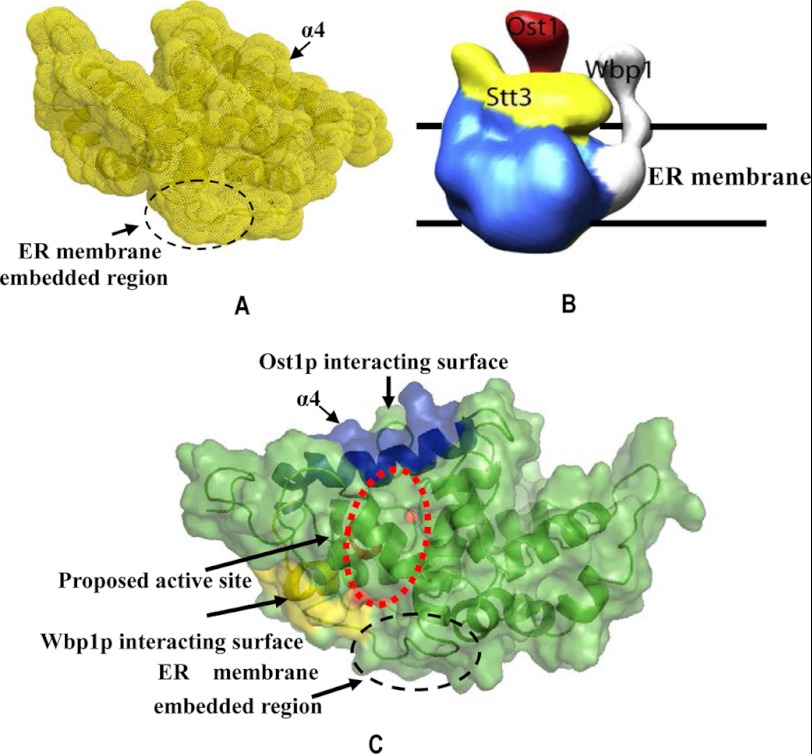
FIGURE 6.
Comparison of the NMR structure of the C-terminal domain of Stt3p with the corresponding region in the EM model of the OT complex (19). A, NMR model of the C-terminal domain of Stt3p. B, EM model of the OT complex. The corresponding region of the C-terminal domain of Stt3p is depicted in yellow in the EM model. Both the NMR and EM structures of the corresponding region present a very good spatial fit to each other. C, proposed interactions between the C-terminal domain of Stt3p and the other OT subunits. To clearly show the interacting surface, the protein orientation in C is different from that shown in A. The proposed surfaces that interact with Ost1p and Wbp1p are colored in blue and yellow, respectively, whereas the proposed active site is indicated by the dashed red circle.

