FIGURE 7.
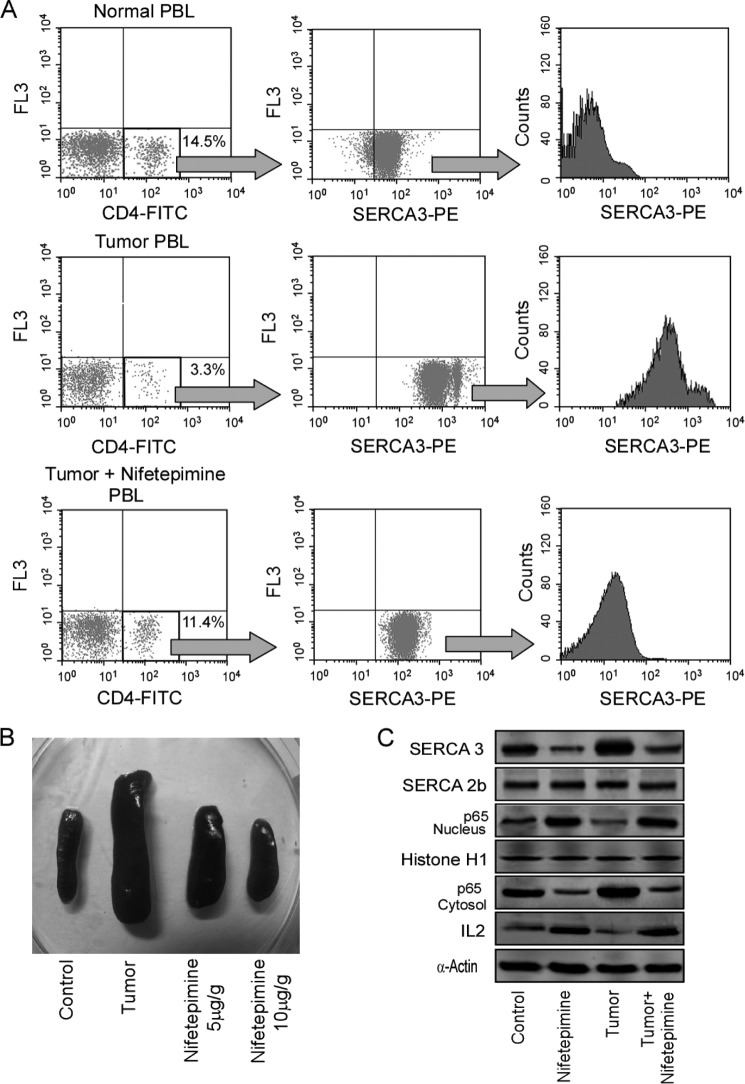
Validation of this immunoprotective mechanism by nifetepimine in tumor-bearing mice models. A, a typical flow cytometric representation shows the percentage of CD4+ T cells in the peripheral circulation from normal, tumor-bearing, and nifetepimine-treated tumor-bearing mice (left panel). Shown are dot plot analysis (middle panel) and a histogram representation for SERCA3 expression in CD4+-gated T cells of control/tumor-bearing and nifetepimine-treated tumor bearing sets (right panel). PE, phosphatidylethanolamine. B, shown is a pictorial representation of the change in spleen size isolated from control, tumor-bearing, and nifetepimine (5 and 10 μg/g body weight)-treated tumor-bearing sets. C, the expression levels of SERCA3 and SERCA2b in control and tumor-bearing mice CD4+ T cells in the presence and absence of nifetepimine treatment were determined by Western blotting. The cytosolic and the nuclear expression status of the transcription factor, p65NF-κB, and also the expression level of IL-2 was determined by Western blot analysis from the above experimental sets. α-Actin/histone H1 was used as internal control. Values are the mean ± S.E. of three independent experiments in each case. PBL, peripheral blood lymphocyte.

