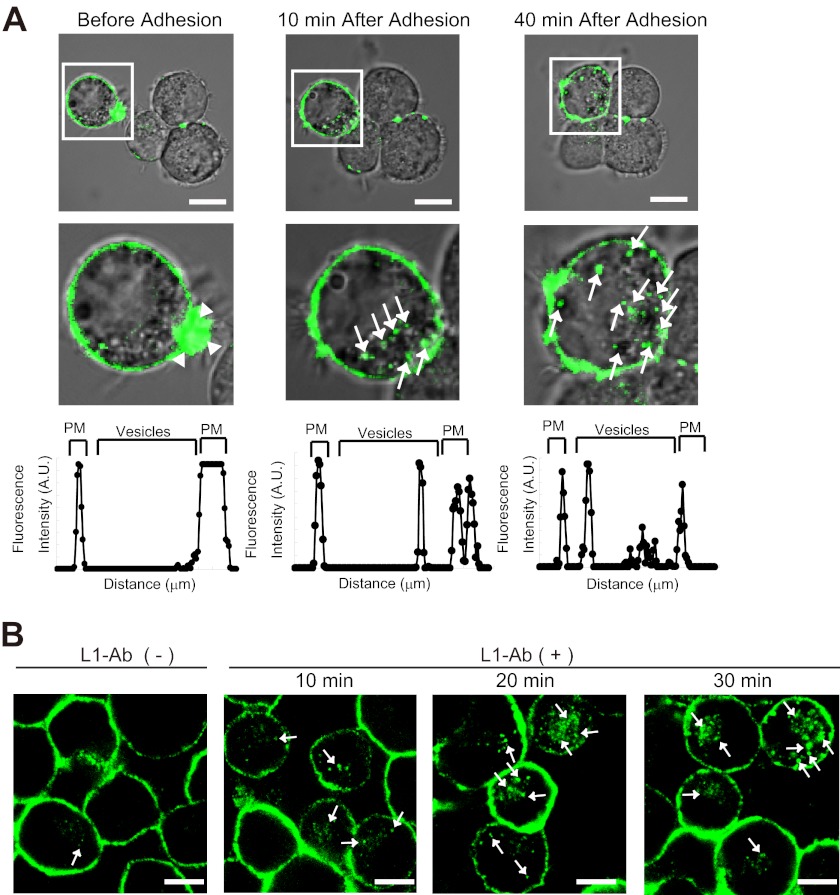
FIGURE 1.
L1 ligand-dependent internalization of L1 in N2a cells. A, time-lapse imaging showing cell adhesion-dependent internalization of L1-GFP (arrows) in N2a cells (upper panels). Note that L1-GFP accumulates on the lamellipodium tip before the cells adhere to each other (arrowheads). White boxed areas are enlarged (middle panels). Scale bars represent 10 μm. A representative density profile plot was generated using SCION Image software (lower panels). Pixel intensity was determined by a row average plot of a section selected from a confocal slice through the center of the cell. PM, plasma membrane. B, L1-Ab-induced endocytosis of L1 in N2a cells. Live cells were incubated with L1-Ab at 4 °C and then incubated for the indicated time periods at 37 °C. Note that a few cells that are in contact show intracellular L1-GFP before L1-Ab-induced endocytosis (left panel). N2a cells were labeled with Alexa Fluor 488-conjugated L1 antibodies (green). Arrows indicate internalized L1. Scale bars represent 10 μm.

