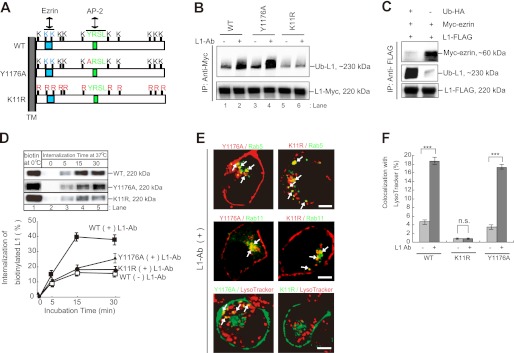
FIGURE 3.
Characterization of L1K11R and L1Y1176A mutants. A, schematic diagram shows the cytoplasmic domain structure of human L1. Light blue, putative ezrin-binding motif (KGGK); light green, tyrosine-based AP-2 binding motif (YRSL). Red characters indicate the sites of point mutations used in this study. TM, transmembrane. B, N2a cells expressing the indicated plasmids were incubated in the presence or absence of L1-Ab. After cell lysis, immunoprecipitation (IP) and immunoblot analyses were performed as indicated. C, after N2a cells coexpressing the indicated plasmids lysis, immunoprecipitation and immunoblot analyses were performed. D, CHX-treated cells were surface-biotinylated at 0 °C (lane 1) and then incubated at 37 °C for periods of 0–30 min (lanes 2–5). Surface-biotinylated proteins were recovered with streptavidin-agarose from cell extracts and analyzed by immunoblotting (upper). Relative amounts of internalized biotinylated L1WT, L1Y1176A, and L1K11R FLAG-tagged were measured by densitometry and expressed as a percentage of the total initial surface biotinylated pool (lower). Data are displayed as the mean ± S.E. (error bars) of triplicate experiments. E, Myc-L1Y1176A or Myc-L1K11R (red; upper and middle panels) was colocalized with GFP-Rab5- and GFP-Rab11-positive endosomal compartments in the presence of L1-Ab (green; upper and middle panels). L1Y1176A-GFP or L1K11R-GFP (green) was colocalized with LysoTracker Red DND-99 (red; bottom panels). Arrows indicate the colocalization (yellow). Scale bars represent 5 μm. F, colocalization of L1WT-GFP, L1Y1176A-GFP, and L1K11R-GFP with LysoTracker was quantified, and the percentage colocalization was plotted for each. Data are displayed as the mean ± S.E. (error bars). ***, p < 0.001; n.s., not significant.

