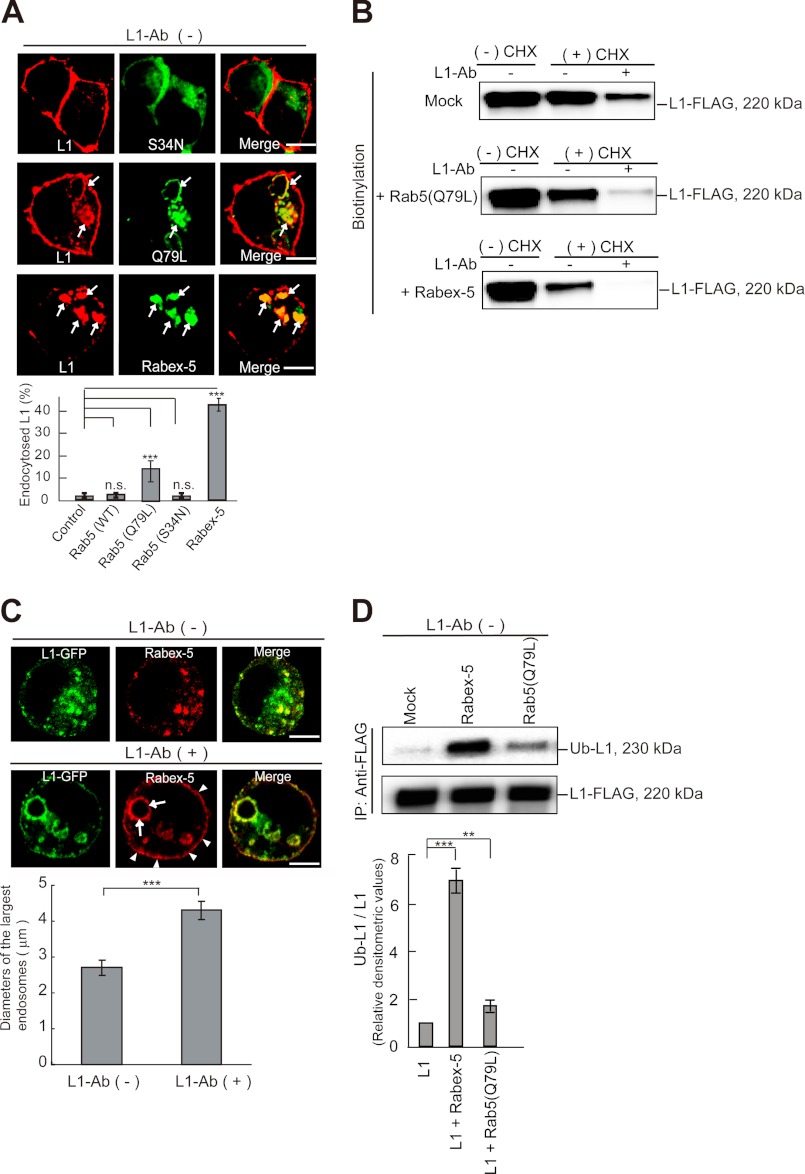
FIGURE 4.
Impact of the expression of Rab5 mutants and Rabex-5 on L1 subcellular distribution. A, colocalization of endogenous L1 with GFP-Rab5 mutants and Myc-tagged Rabex-5 in N2a cells (upper) is shown. Arrows indicate internalized L1 in Rab5Q79L- and Rabex-5-positive endosomes. Scale bars represent 5 μm. Fluorescence intensities were quantified, and the percentage of perinuclear to total fluorescence was plotted (lower). Data are displayed as the mean ± S.E. (error bars). ***, p < 0.001; n.s., not significant. B, CHX-nontreated cells (−CHX) or CHX-treated cells (+CHX) expressing the indicated plasmids were surface-biotinylated. Cells were then incubated in the presence or absence of L1-Ab. Surface-biotinylated proteins were recovered with streptavidin-agarose from cell extracts and analyzed by immunoblotting. C, N2a cells expressing L1-GFP (green) and Myc-tagged Rabex-5 (red) were incubated in the absence (upper panels) or presence (middle panels) of L1-Ab. Arrowheads and arrows indicate plasma membrane-targeted Rabex-5 and Rabex-5-induced enlarged endosomes, respectively. Scale bars represent 5 μm. The diameters of the largest Rabex-5-labeled endosomes in 30 cells expressing Myc-tagged Rabex-5 were measured; the graph shows the mean ± S.E. (lower). ***, p < 0.001. D, N2a cells were transfected with the indicated plasmids. Accumulation of monoubiquitinated L1 was examined by immunoprecipitation and analyzed by immunoblotting (upper). Bars represent the relative densitometric values of Ub-L1/L1 (lower). Data are displayed as the mean ± S.E. ***, p < 0.001; **, p < 0.01.

