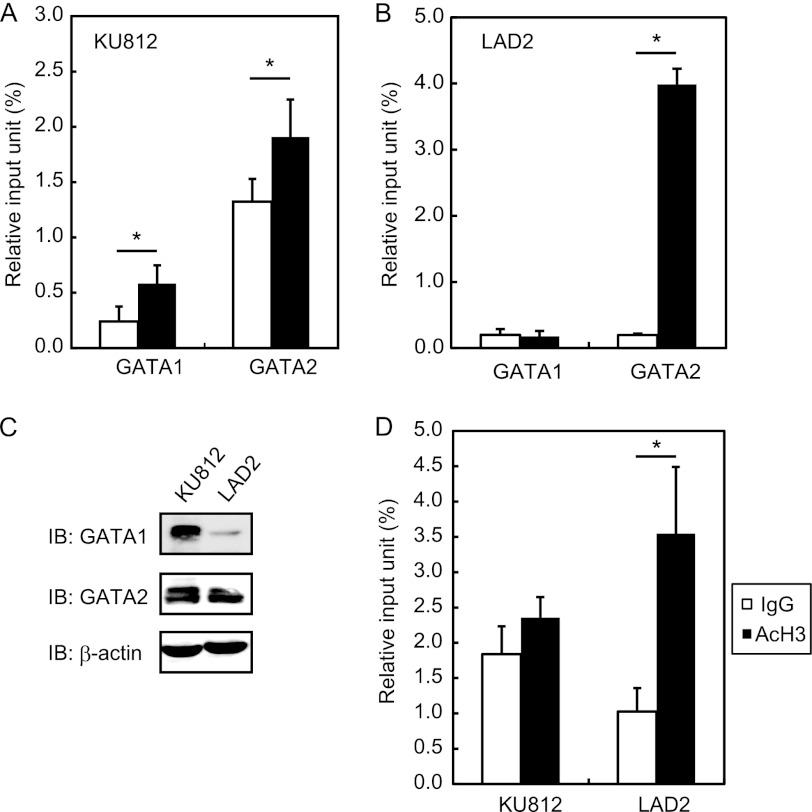
FIGURE 3.
Quantitative analyses of GATA1 and GATA2 binding to the ST2 promoter and of the degree of histone H3 acetylation at the ST2 promoter by ChIP assays. ChIP assays were performed to examine GATA1 and GATA2 binding to the ST2 promoter in KU812 (A) and LAD2 (B) cells. C, Western blot analysis with anti-GATA1, anti-GATA2, or anti-β-actin Ab. IB, immunoblot. D, ChIP assay with anti-acetylated histone H3 (AcH3) Ab. Data represent means ± S.D. of triplicate samples. Black bars, specific Ab; white bars, control Ab. *, p < 0.05.

