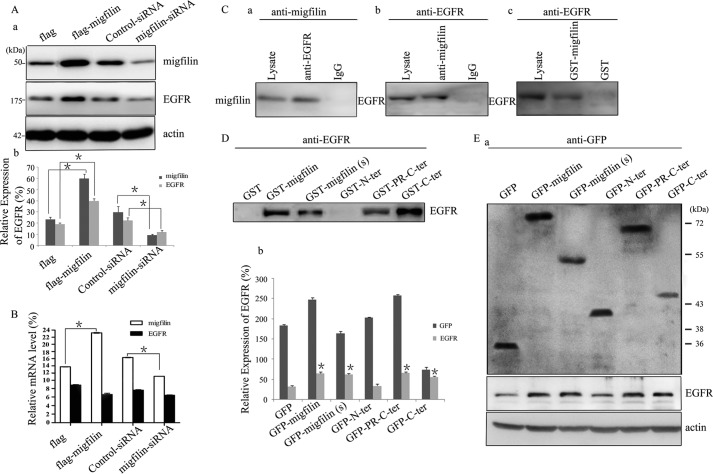
FIGURE 4.
Migfilin up-regulates the expression of EGFR and forms a complex with EGFR in glioma cells. A, panel a, expression of EGFR was analyzed by Western blotting in Migfilin-transfected and Migfilin siRNA-transfected cells. Protein expression levels were normalized with actin. A, panel b, bar chart shows the relative expression of EGFR. Protein quantification was obtained by densitometric analysis of the protein absorbance × resulting band area. Protein quantified was relative to the actin internal control. All experiments were performed at least three times with consistent and repeatable results. Each value is expressed as mean ± S.D. (n = 3). *, p < 0.05 versus FLAG or Control-siRNA. B, quantification of changes of EGFR mRNA levels in Migfilin-transfected and Migfilin siRNA-transfected cells. mRNA expression levels were normalized with GAPDH. *, p < 0.05 versus FLAG or Control-siRNA. C, panels a and b, immunoprecipitation of Migfilin and EGFR. Lysates of human U-87 MG cells were mixed with rabbit anti-EGFR antibody (panel a) or mouse anti-Migfilin mAb (panel b). The immunoprecipitates or the control precipitates were analyzed by Western blotting with anti-Migfilin and EGFR antibodies, respectively. Panel c, GST fusion protein pulldown assay. Human U-87 MG cell lysates were incubated with GST-Migfilin fusion protein or GST. GST-Migfilin and GST were precipitated with glutathione beads. EGFR was detected by Western blotting with an anti-EGFR mAb. D, GST fusion protein pulldown assay. Human U-87 MG cell lysates were incubated with GST-Migfilin mutant fusion proteins or GST. GST-Migfilin mutant fusion proteins and GST were precipitated with glutathione beads. EGFR was detected by Western blotting with an anti-EGFR mAb. E, panel a, ectopic expression of mutant Migfilin in U-87 MG cells lines was analyzed by Western blotting using an anti-GFP antibody; The expression of EGFR was analyzed by Western blotting in U-87 MG cells transfected Migfilin mutant plasmids. Protein expression levels were normalized with actin; panel b, bar chart shows the relative expression of GFP and EGFR. Protein quantification was obtained by densitometric analysis of the protein absorbance × resulting band area. Protein quantified was relative to the actin internal control. All experiments were performed at least three times with consistent and repeatable results. Each value is expressed as mean ± S.D. (n = 3). *, p < 0.05 versus GFP.

