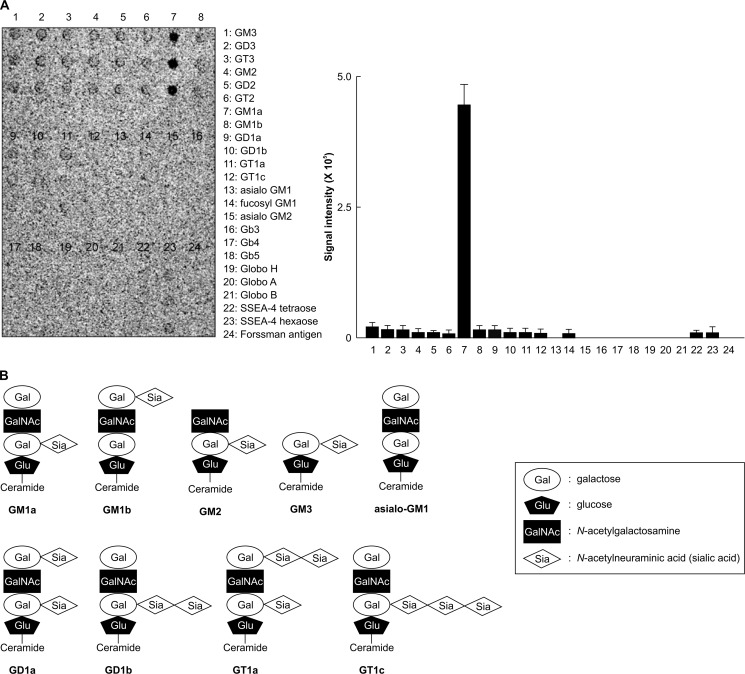
FIGURE 2.
Glycoarray analysis. A, the glycoarray plate was incubated with 100 μg/ml Cy3-alpha-toxin for 15 min. Fluorescence intensity of the toxin on the plate was measured with a fluorescence scanner. Values represent the mean ± S.D. *, p < 0.01 (n = 3). B, schematic figures of representative gangliosides described in the study are shown. SSEA-4 tetraose, Neu5Acα2-3Galβ1-3GalNAcβ1-3Gal; SSEA-4 hexaose, Neu5Acα2-3Galβ1-3GalNAcβ1-3Galα1-4Galβ1-4Glc.

