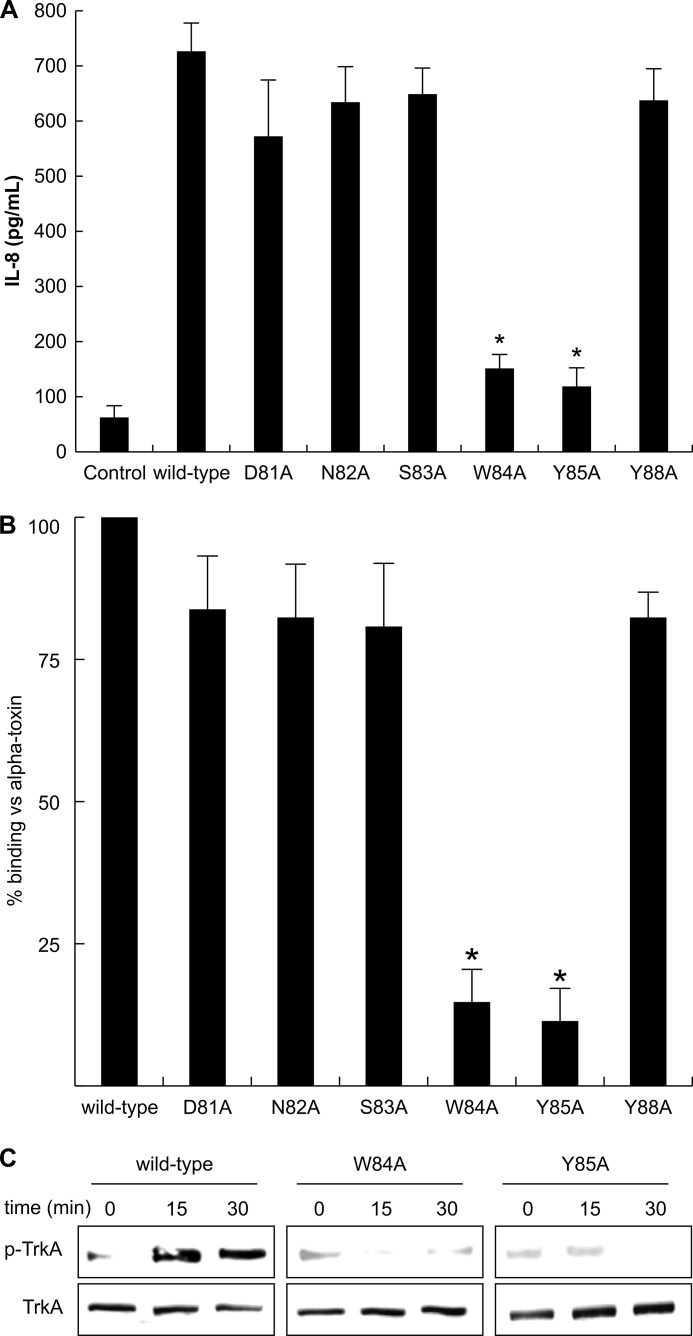
FIGURE 6.
The role of amino acids coordinated at the loop region of the alpha-toxin. A, A549 cells (1 × 10⁷ cells/ml) were incubated with various toxins (1.0 μg/ml) at 37 °C for 3 h. IL-8 in the culture supernatants was assayed with an ELISA kit. Values represent the mean ± S.E.; n = 3; *, p < 0.005, compared with the release of IL-8 in the cells treated with wild-type toxin. B, A549 cells (1 × 10⁷ cells/ml) were incubated with Cy3-variant toxin (1.0 μg/ml) for 15 min. The cells were fixed in 4% paraformaldehyde and analyzed using fluorescence microscopy. The fluorescent intensity in the visual fields was measured as described under “Experimental Procedures.” The binding of wild-type toxin to the cells was set as the maximal response (100%), against which all other results were compared. Values represent the mean ± S.E.; n = 3; *, p < 0.01, compared with the binding of the wild-type toxin in A549 cells. C, A549 cells (1 × 10⁷ cells/ml) were incubated with wild-type toxin or the W84A and Y85A variants at 37 °C for 15 and 30 min. The lysates were subjected to SDS-PAGE followed by immunoblotting with antibodies against phosphorylated TrkA and TrkA. The data represent the mean for three independent experiments.

