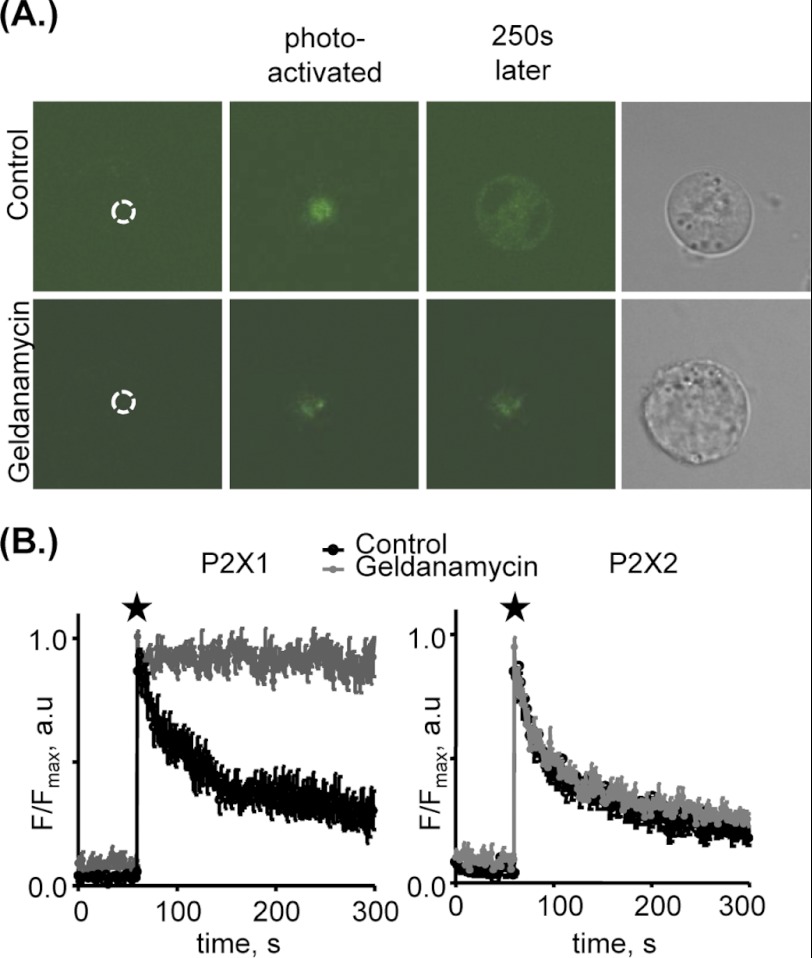
FIGURE 2.
HSP90 promotes trafficking of P2X1 but not P2X2 receptors. A, representative snapshots of HEK293 cells expressing P2X1 receptors C-terminally tagged with PAGFP. Fluorescent images represent the cell in control conditions or treated with 2 μm geldanamycin (>30 min) before P2X1-PAGFP activation (dotted circle indicates region to be photoactivated), immediately after activation (indicated by star), and 250 s after photoactivation. Right panel, brightfield images of the cell. Under control conditions the P2X1-PAGFP fluorescence moves away from the site of illumination; however, following geldanamycin treatment the P2X1-PAGFP remains predominantly within the area of photoillumination. B, averaged changes in fluorescence in control cells and cells treated with geldanamycin as fraction of maximal fluorescence observed immediately after activation of P2X1-PAGFP (indicated by star) or P2X2-PAGFP, within the cell; size of activated area, 6 μm2 (n = 5–9). Images were taken on an Olympus inverted microscope with a confocal laser scanning module (OlympusFluoView1000). Cells were imaged with a 60× oil immersion objective (UPLASAPO 60×, NA 1.35). Cells were bathed in standard extracellular solution at room temperature. Fluorescent intensities of regions of interest were obtained using FluoView software. Values are shown as means ± S.E.

