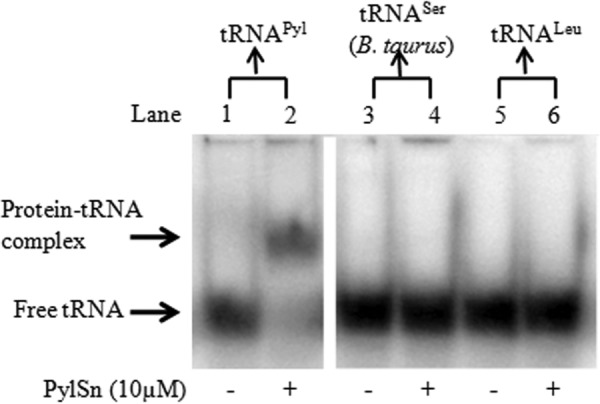
FIGURE 4.

Specificity of D. hafniense PylSn for binding tRNAPyl as measured by electrophoretic shift. The panels show electrophoretic mobility shift assay of 0 μm and 10 μm PylSn with 17 nm tRNAPyl (lanes 1 and 2); 0 μm and 10 μm PylSn with 30 nm B. taurus mitochondrial tRNASer (lanes 3 and 4); and 0 μm and 10 μm PylSn with 30 nm tRNALeu (lanes 5 and 6). Both panels are from the same polyacrylamide gel.
