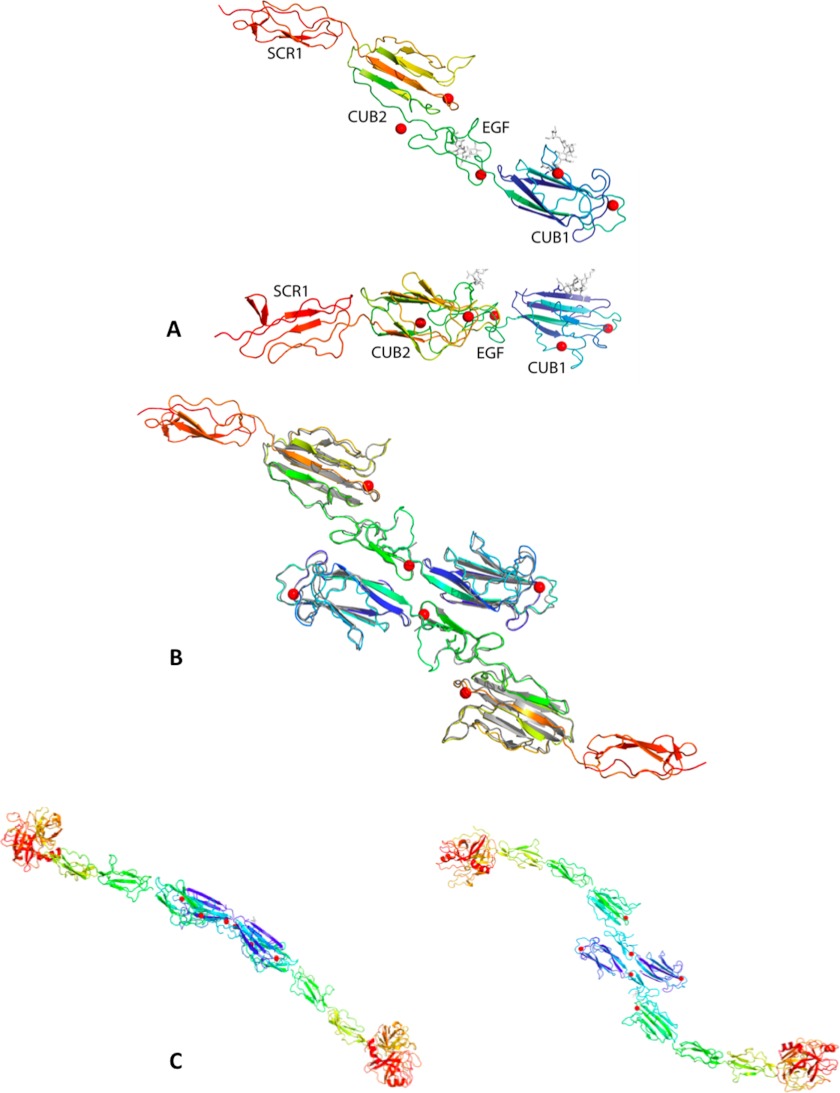
FIGURE 3.
Structural models of MAP-1 and MASP-1. A, MAP-1 monomers are shown and are colored blue to red from the N to C terminus. Ca+2 ions involved in the dimerization are represented as red spheres, and N-linked glycans at Asn-49 and Asn-178 are represented in gray sticks. The two views are related by a 90° rotation around the horizontal axis. B, the MAP-1 dimer, colored as in A, overlaid onto the MASP-1 CUB1-EGF-CUB2 dimer from PDB ID 3DEM (gray). C, shown are two views of a model for the entire MASP-1 dimer, colored blue to red from the N to C termini. It was obtained by overlaying onto the MAP-1 dimer the two portions of the MASP-1 molecule from PDB IDs 3GOV (CUB1-EGF-CUB2) and 3DEM (SCR1-SCR2-SP). The two views are rotated by 90° around the horizontal direction.

