FIGURE 6.
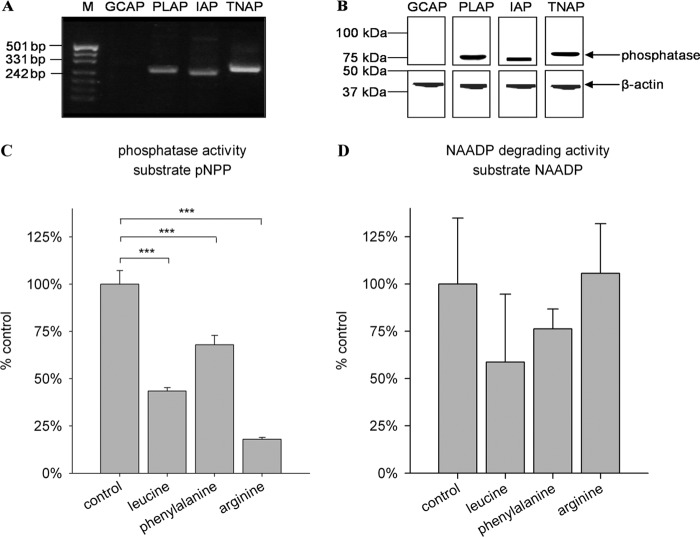
Expression and isoform-specific inhibition of AP isoenzymes in HeLa cells. A and B, expression analysis. A, expression analysis of AP at the mRNA level. Total RNA was extracted from HeLa cells and subjected to RT-PCR using primers specific for the different isoenzymes. Sizes of PCR products were analyzed by gel electrophoresis. Sequences of PCR products were verified by TA cloning and sequencing (not shown). mRNAs coding for PLAP (259 bp), IAP (250 bp), and TNAP (281 bp) but not GCAP (251 bp) were detected. M, marker (pUC (MspI)). B, expression analysis of AP at the protein level. Membrane protein from HeLa cells (10 μg) was separated by SDS-PAGE and transferred onto a PVDF membrane. One part of the membrane was incubated with an antibody detecting β-actin as a loading control. AP was detected with antibodies specific for the different isoenzymes. AP is highly glycosylated, and therefore, the apparent molecular mass is larger than the predicted molecular mass (57 kDa). C and D, isoform-specific inhibition. C, membrane protein from HeLa cells (1 μg/ml) was preincubated with 10 mm inhibitor for 10 min on ice. pNPP (5.5 mm) was then added and incubated for 20 min. Absorption of the dephosphorylated reaction product was measured at λ = 405 nm. D, membrane protein from HeLa cells (1 μg/ml) was preincubated with 10 mm inhibitor for 10 min on ice. NAADP (10 μm) was then added and incubated for 30 min. Release of phosphate was assessed with the malachite green assay. Data shown are means ± S.D. (n = 4–8). ***, p < 0.001 (analysis of variance).

